ISTIO & KServe
Deploying with KServe on ISTIO

IRSA (IAM Roles for Service Accounts)
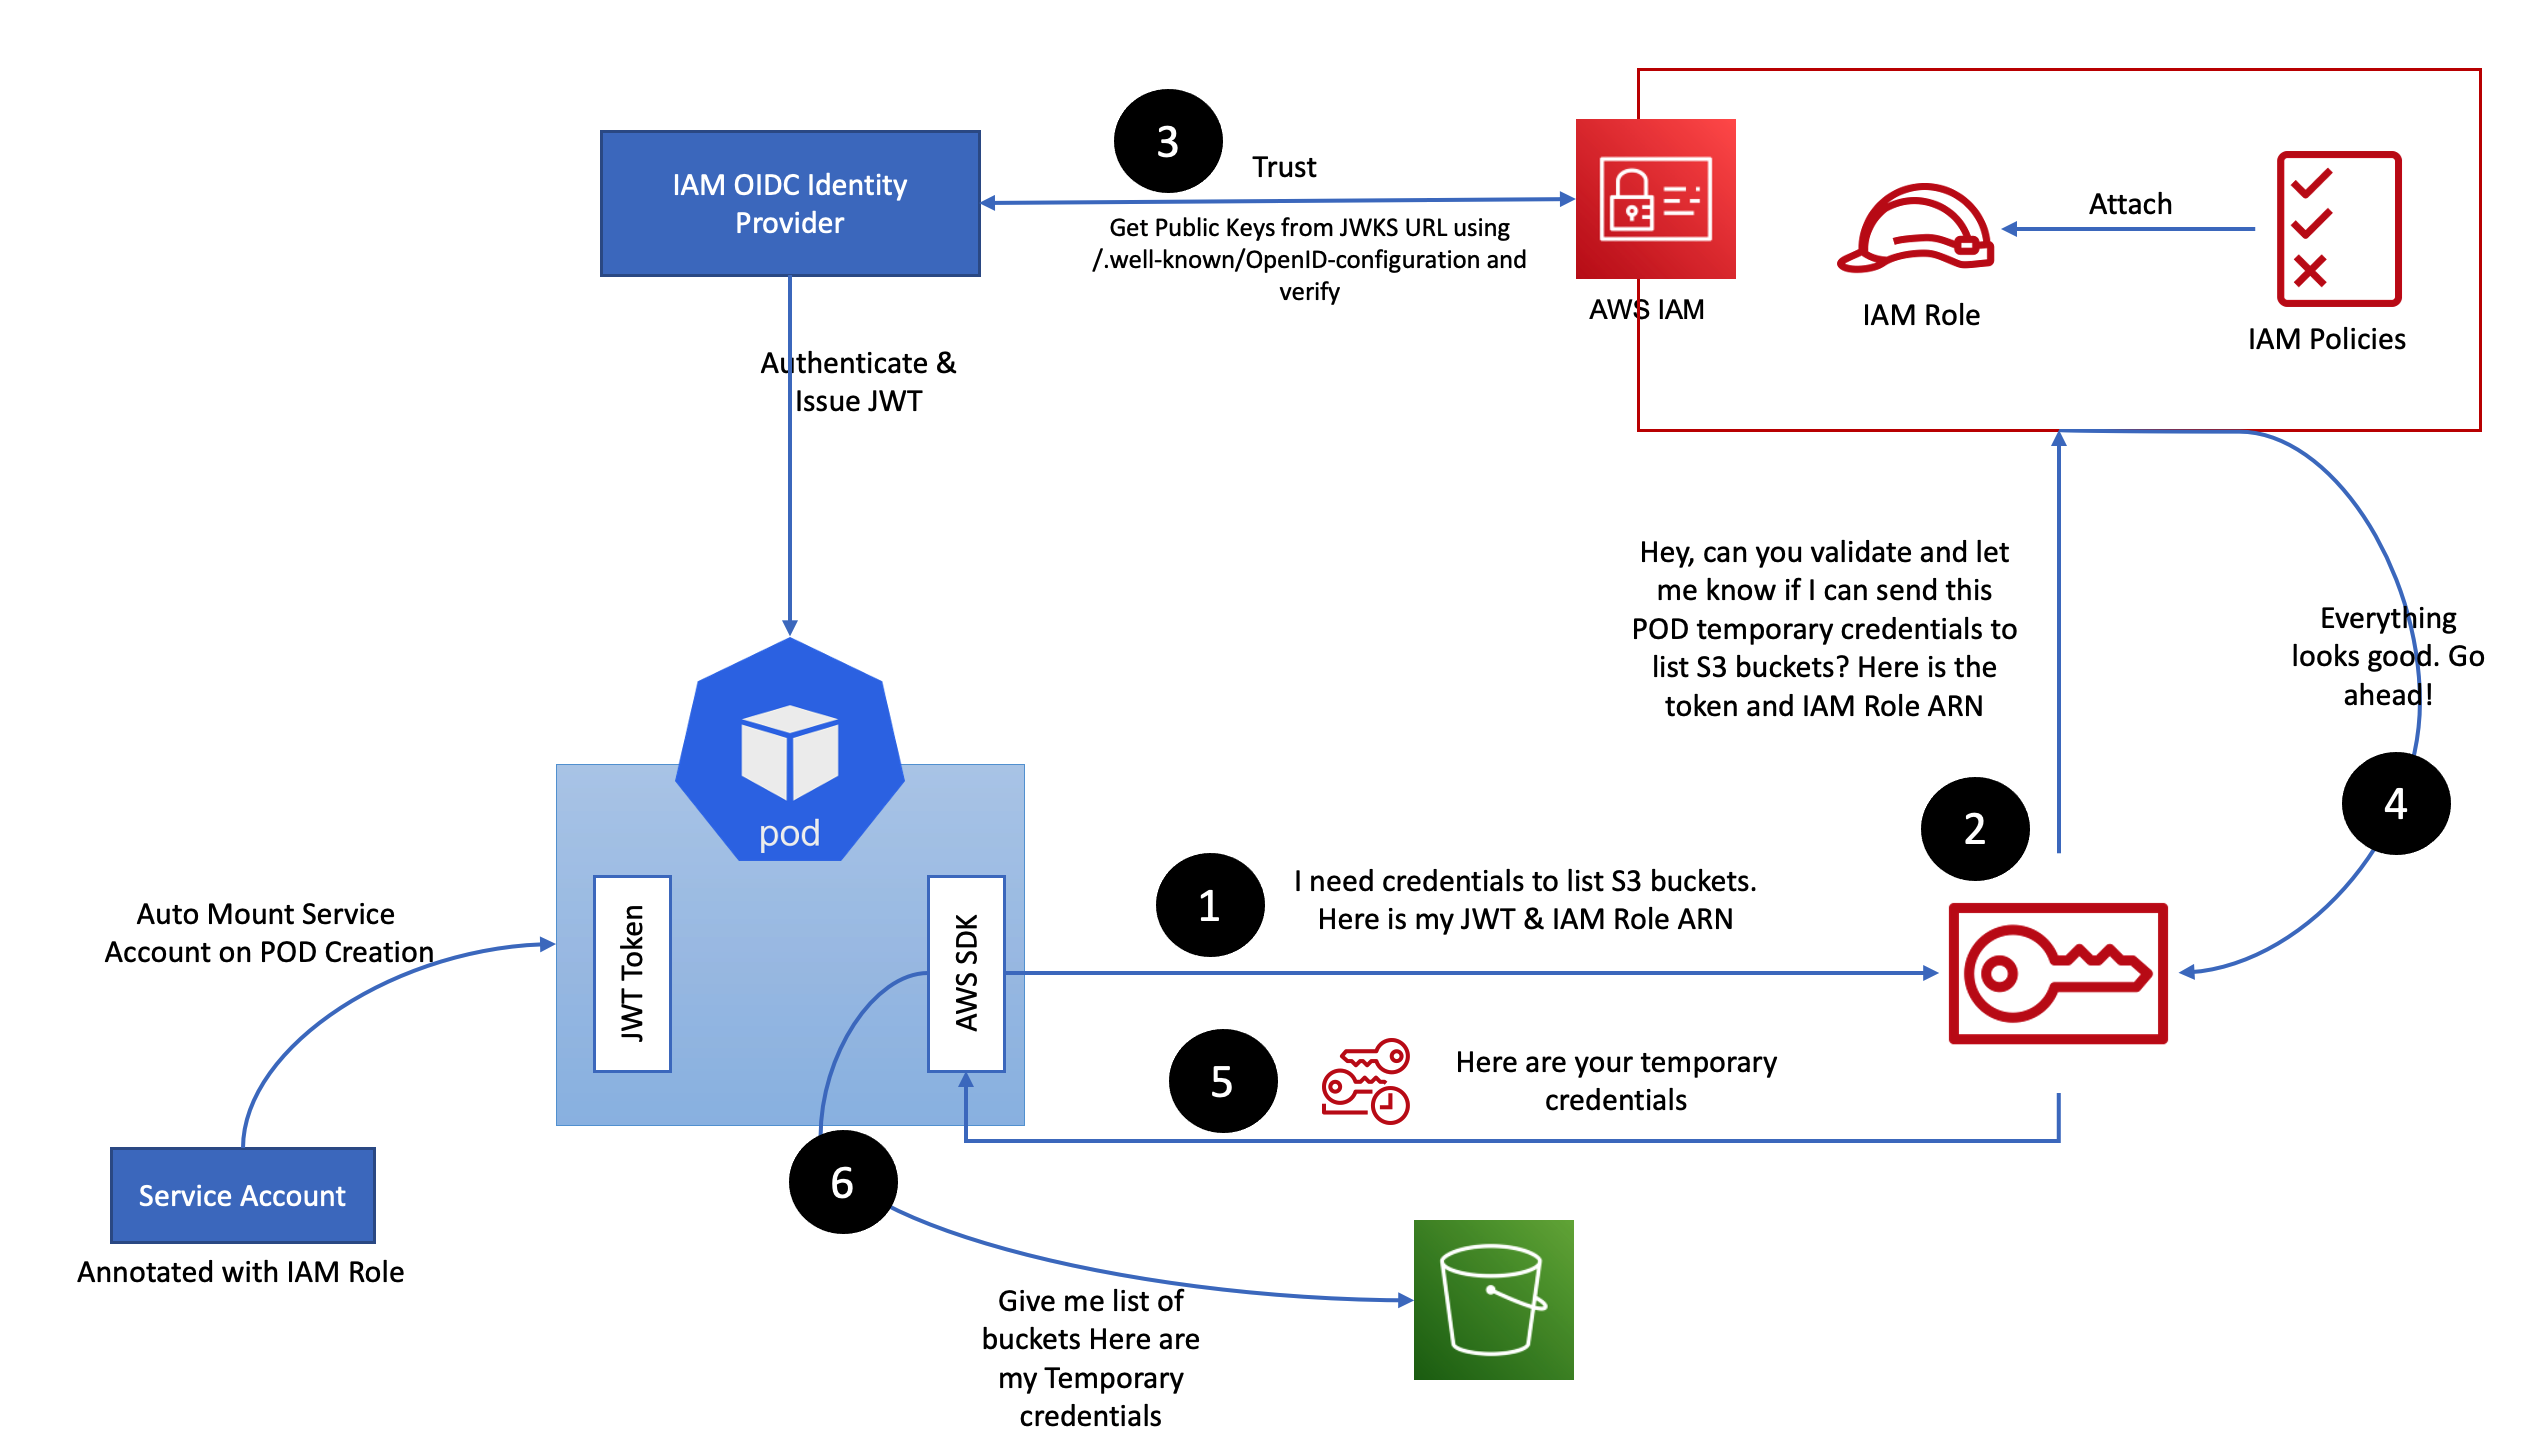
Make sure OIDC is enabled for your Cluster
eksctl utils associate-iam-oidc-provider --region ap-south-1 --cluster basic-cluster --approveCreate IAM Policy
iam-s3-test-policy.json
{
    "Version": "2012-10-17",
    "Statement": [
        {
            "Effect": "Allow",
            "Action": [
                "s3:ListBucket"
            ],
            "Resource": "arn:aws:s3:::pytorch-models"
        },
        {
            "Sid": "List",
            "Effect": "Allow",
            "Action": [
                "s3:GetObject",
                "s3:GetObjectVersion"
            ],
            "Resource": "arn:aws:s3:::pytorch-models/*"
        }
    ]
}
aws iam create-policy \
--policy-name S3ListTest \
--policy-document file://iam-s3-test-policy.jsonMake sure the policy is created
aws iam get-policy-version --policy-arn arn:aws:iam::ACCOUNT_ID:policy/S3ListTest --version-id v1
Create IRSA
eksctl create iamserviceaccount \
  --name s3-list-sa \
  --cluster basic-cluster \
  --attach-policy-arn arn:aws:iam::ACCOUNT_ID:policy/S3ListTest \
  --approve \
	--region ap-south-1
This will Create the s3-list-sa Service Account with our defined Policy
❯ kg sa
NAME         SECRETS   AGE
default      0         10m
s3-list-sa   0         5s
k describe sa s3-list-saCreate a Pod with the Service Account Attached to it
aws-cli-pod.yaml
apiVersion: v1
kind: Pod
metadata:
  name: aws-cli
spec:
  serviceAccountName: s3-list-sa
  containers:
  - name: aws-cli
    image: amazon/aws-cli:latest
    command:
      - sleep
      - "3600"
    imagePullPolicy: IfNotPresent
  restartPolicy: Always
k apply -f aws-cli-pod.yamlk exec -it aws-cli -- aws sts get-caller-identitykubectl exec -it aws-cli -- aws s3 ls s3://YOUR_BUCKET❯ kubectl exec -it aws-cli -- aws s3 ls s3://pytorch-models
PRE config/
PRE model-store/kubectl exec -it aws-cli -- bashNow we can run aws s3 commands to check
EBS on EKS
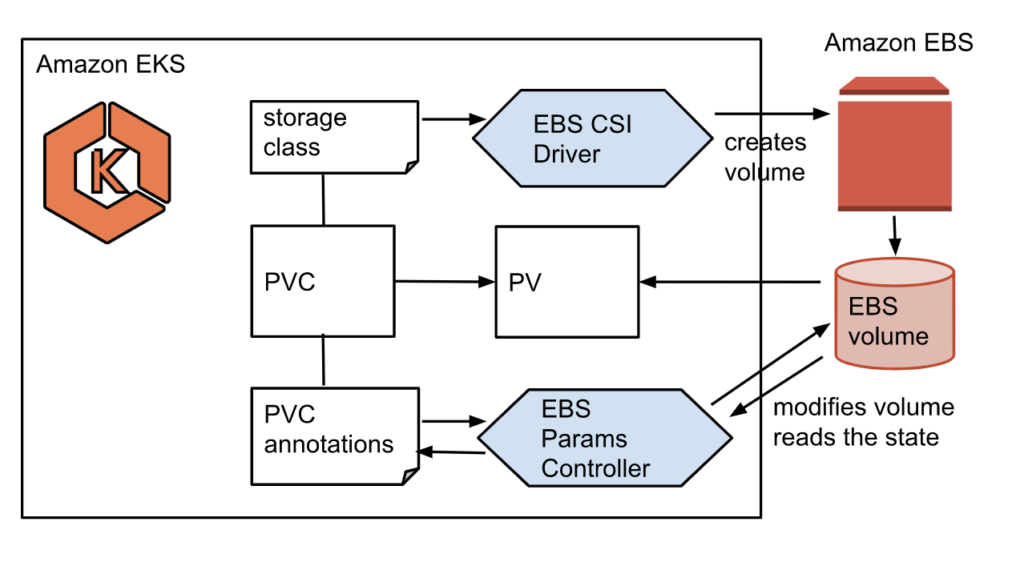
Make sure OIDC is enabled for your Cluster
eksctl utils associate-iam-oidc-provider --region ap-south-1 --cluster basic-cluster --approveInstall the EBS CSI Addon
First create the IRSA for EBS
eksctl create iamserviceaccount \
    --name ebs-csi-controller-sa \
    --namespace kube-system \
    --cluster basic-cluster \
    --role-name AmazonEKS_EBS_CSI_DriverRole \
    --role-only \
    --attach-policy-arn arn:aws:iam::aws:policy/service-role/AmazonEBSCSIDriverPolicy \
    --approve \
		--region ap-south-1
Create the EBS CSI Driver Addon
eksctl create addon --name aws-ebs-csi-driver --cluster basic-cluster --service-account-role-arn arn:aws:iam::581084559687:role/AmazonEKS_EBS_CSI_DriverRole --region ap-south-1 --forceebs-csi-controller-sa 0 4s
ebs-csi-node-sa 0 4sTesting out the EBS Dynamic PV
git clone https://github.com/kubernetes-sigs/aws-ebs-csi-driver.gitcd aws-ebs-csi-driver/examples/kubernetes/dynamic-provisioning/Set the Storage Class to GP3
echo "parameters:
  type: gp3" >> manifests/storageclass.yaml
Deploy the example Pod, SC and PVC
kubectl apply -f manifests/❯ kubectl describe storageclass ebs-sc
Name: ebs-sc
IsDefaultClass: No
Annotations: kubectl.kubernetes.io/last-applied-configuration={"apiVersion":"storage.k8s.io/v1","kind":"StorageClass","metadata":{"annotations":{},"name":"ebs-sc"},"parameters":{"type":"gp3"},"provisioner":"ebs.csi.aws.com","volumeBindingMode":"WaitForFirstConsumer"}
Provisioner: ebs.csi.aws.com
Parameters: type=gp3
AllowVolumeExpansion: <unset>
MountOptions: <none>
ReclaimPolicy: Delete
VolumeBindingMode: WaitForFirstConsumer
Events: <none>❯ kg pv
NAME CAPACITY ACCESS MODES RECLAIM POLICY STATUS CLAIM STORAGECLASS REASON AGE
pvc-a1ab07e7-20c4-43f8-9ca8-be47542b3128 4Gi RWO Delete Bound default/ebs-claim ebs-sc 48s
❯ kg pvc
NAME STATUS VOLUME CAPACITY ACCESS MODES STORAGECLASS AGE
ebs-claim Bound pvc-a1ab07e7-20c4-43f8-9ca8-be47542b3128 4Gi RWO ebs-sc 69sWe can exec inside the pod to verify
❯ kubectl exec -it app -- bash
[root@app /]# ls
bin  data  dev  etc  home  lib  lib64  lost+found  media  mnt  opt  proc  root  run  sbin  srv  sys  tmp  usr  var
[root@app /]# df -h
Filesystem      Size  Used Avail Use% Mounted on
overlay          80G  4.7G   76G   6% /
tmpfs            64M     0   64M   0% /dev
tmpfs           1.9G     0  1.9G   0% /sys/fs/cgroup
/dev/nvme1n1    3.9G   28K  3.9G   1% /data
/dev/nvme0n1p1   80G  4.7G   76G   6% /etc/hosts
shm              64M     0   64M   0% /dev/shm
tmpfs           3.3G   12K  3.3G   1% /run/secrets/kubernetes.io/serviceaccount
tmpfs           1.9G     0  1.9G   0% /proc/acpi
tmpfs           1.9G     0  1.9G   0% /sys/firmware
Nodes can also be described!
kubectl describe nodeCapacity:
attachable-volumes-aws-ebs: 25
cpu: 2
ephemeral-storage: 83873772Ki
hugepages-1Gi: 0
hugepages-2Mi: 0
memory: 3955652Ki
pods: 17Allocatable:
attachable-volumes-aws-ebs: 25
cpu: 1930m
ephemeral-storage: 76224326324
hugepages-1Gi: 0
hugepages-2Mi: 0
memory: 3400644Ki
pods: 17Allocated resources:
(Total limits may be over 100 percent, i.e., overcommitted.)
Resource Requests Limits
-------- -------- ------
cpu 265m (13%) 100m (5%)
memory 320Mi (9%) 1068Mi (32%)
ephemeral-storage 0 (0%) 0 (0%)
hugepages-1Gi 0 (0%) 0 (0%)
hugepages-2Mi 0 (0%) 0 (0%)
attachable-volumes-aws-ebs 0 0GPU on EKS

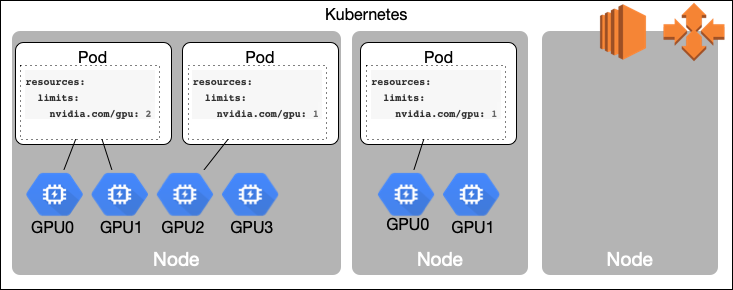
Just add the relevant Instance Type and thats it!
  - name: ng-gpu-spot-1
    instanceType: g4dn.xlarge
    desiredCapacity: 1
    ssh:
      allow: true
    spot: true
    labels:
      role: spot
    propagateASGTags: true
    iam:
      withAddonPolicies:
        autoScaler: true
        awsLoadBalancerController: true
        certManager: true
        externalDNS: true
        ebs: true
https://eksctl.io/usage/gpu-support
GPU Nodes on EKS
❯ kubectl get nodes -L node.kubernetes.io/instance-type
NAME                                           STATUS   ROLES    AGE   VERSION                INSTANCE-TYPE
ip-192-168-11-162.us-west-2.compute.internal   Ready    <none>   98m   v1.25.13-eks-43840fb   g4dn.xlarge
ip-192-168-31-105.us-west-2.compute.internal   Ready    <none>   98m   v1.25.13-eks-43840fb   t3a.medium
ip-192-168-52-111.us-west-2.compute.internal   Ready    <none>   98m   v1.25.13-eks-43840fb   t3a.medium
ip-192-168-62-41.us-west-2.compute.internal    Ready    <none>   98m   v1.25.13-eks-43840fb   t3a.medium
ip-192-168-70-252.us-west-2.compute.internal   Ready    <none>   98m   v1.25.13-eks-43840fb   t3a.medium
ip-192-168-72-36.us-west-2.compute.internal    Ready    <none>   98m   v1.25.13-eks-43840fb   g4dn.xlarge
ip-192-168-78-219.us-west-2.compute.internal   Ready    <none>   98m   v1.25.13-eks-43840fb   t3a.medium
ip-192-168-86-215.us-west-2.compute.internal   Ready    <none>   98m   v1.25.13-eks-43840fb   t3a.medium
NVIDIA MIG
MIG (Multi-Instance GPU) can partition the GPU into as many as seven instances, each fully isolated with its own high-bandwidth memory, cache, and compute cores.
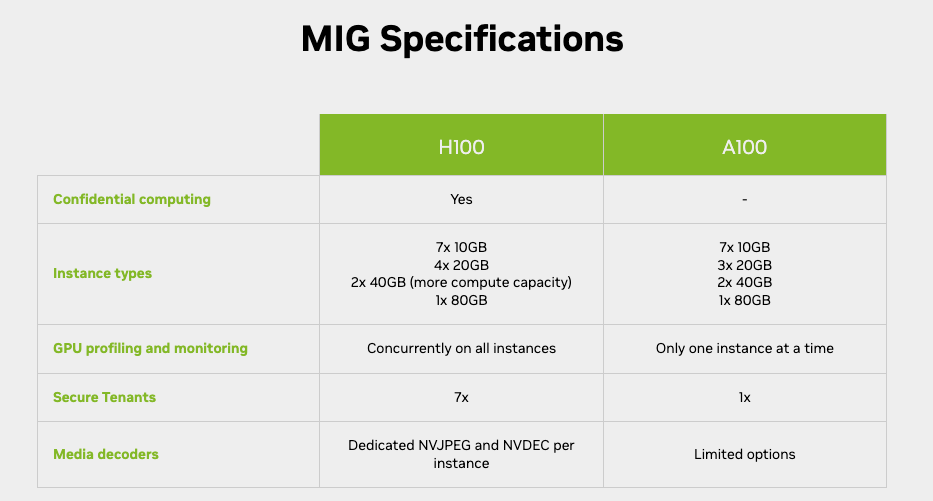
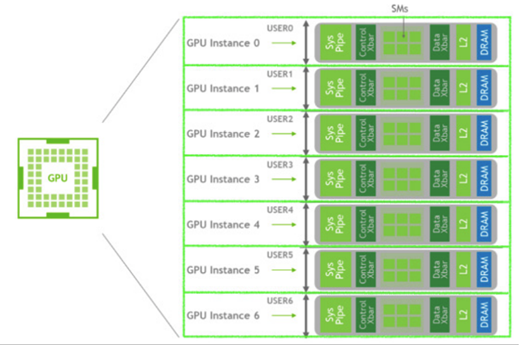
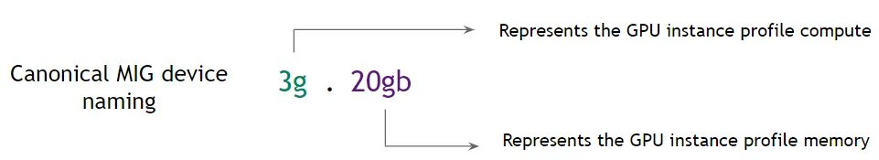
With the MIG single strategy, you can create MIG devices of the same size. For instance, on a P4d.24XL, the options include creating 56 slices of 1g.5gb, 24 slices of 2g.10gb, 16 slices of 3g.20gb, or a single slice of either 4g.40gb or 7g.40gb.
Suppose we have several teams working on simulations and deep learning. With the MIG single strategy, you can give each team the GPU power they need, making the most of the P4d.24XL. This approach is great when all tasks need the same amount of GPU and when tasks can run at the same time.
On the other hand, the mixed strategy offers more flexibility. It lets you combine different-sized slices, such as a few 1g.5gb slices with some 2g.10gb and 3g.20gb slices. This approach is particularly beneficial when your cluster handles tasks with diverse GPU needs.
Istio
Istio is the leading example of a new class of projects called Service Meshes. Service meshes manage traffic between microservices at layer 7 of the OSI Model. Using this in-depth knowledge of the traffic semantics – for example HTTP request hosts, methods, and paths – traffic handling can be much more sophisticated.
Istio works by having a small network proxy sit alongside each microservice. This so-called “sidecar” intercepts all of the service’s traffic, and handles it more intelligently than a simple layer 3 network can. Istio uses the Envoy proxy as its sidecar.

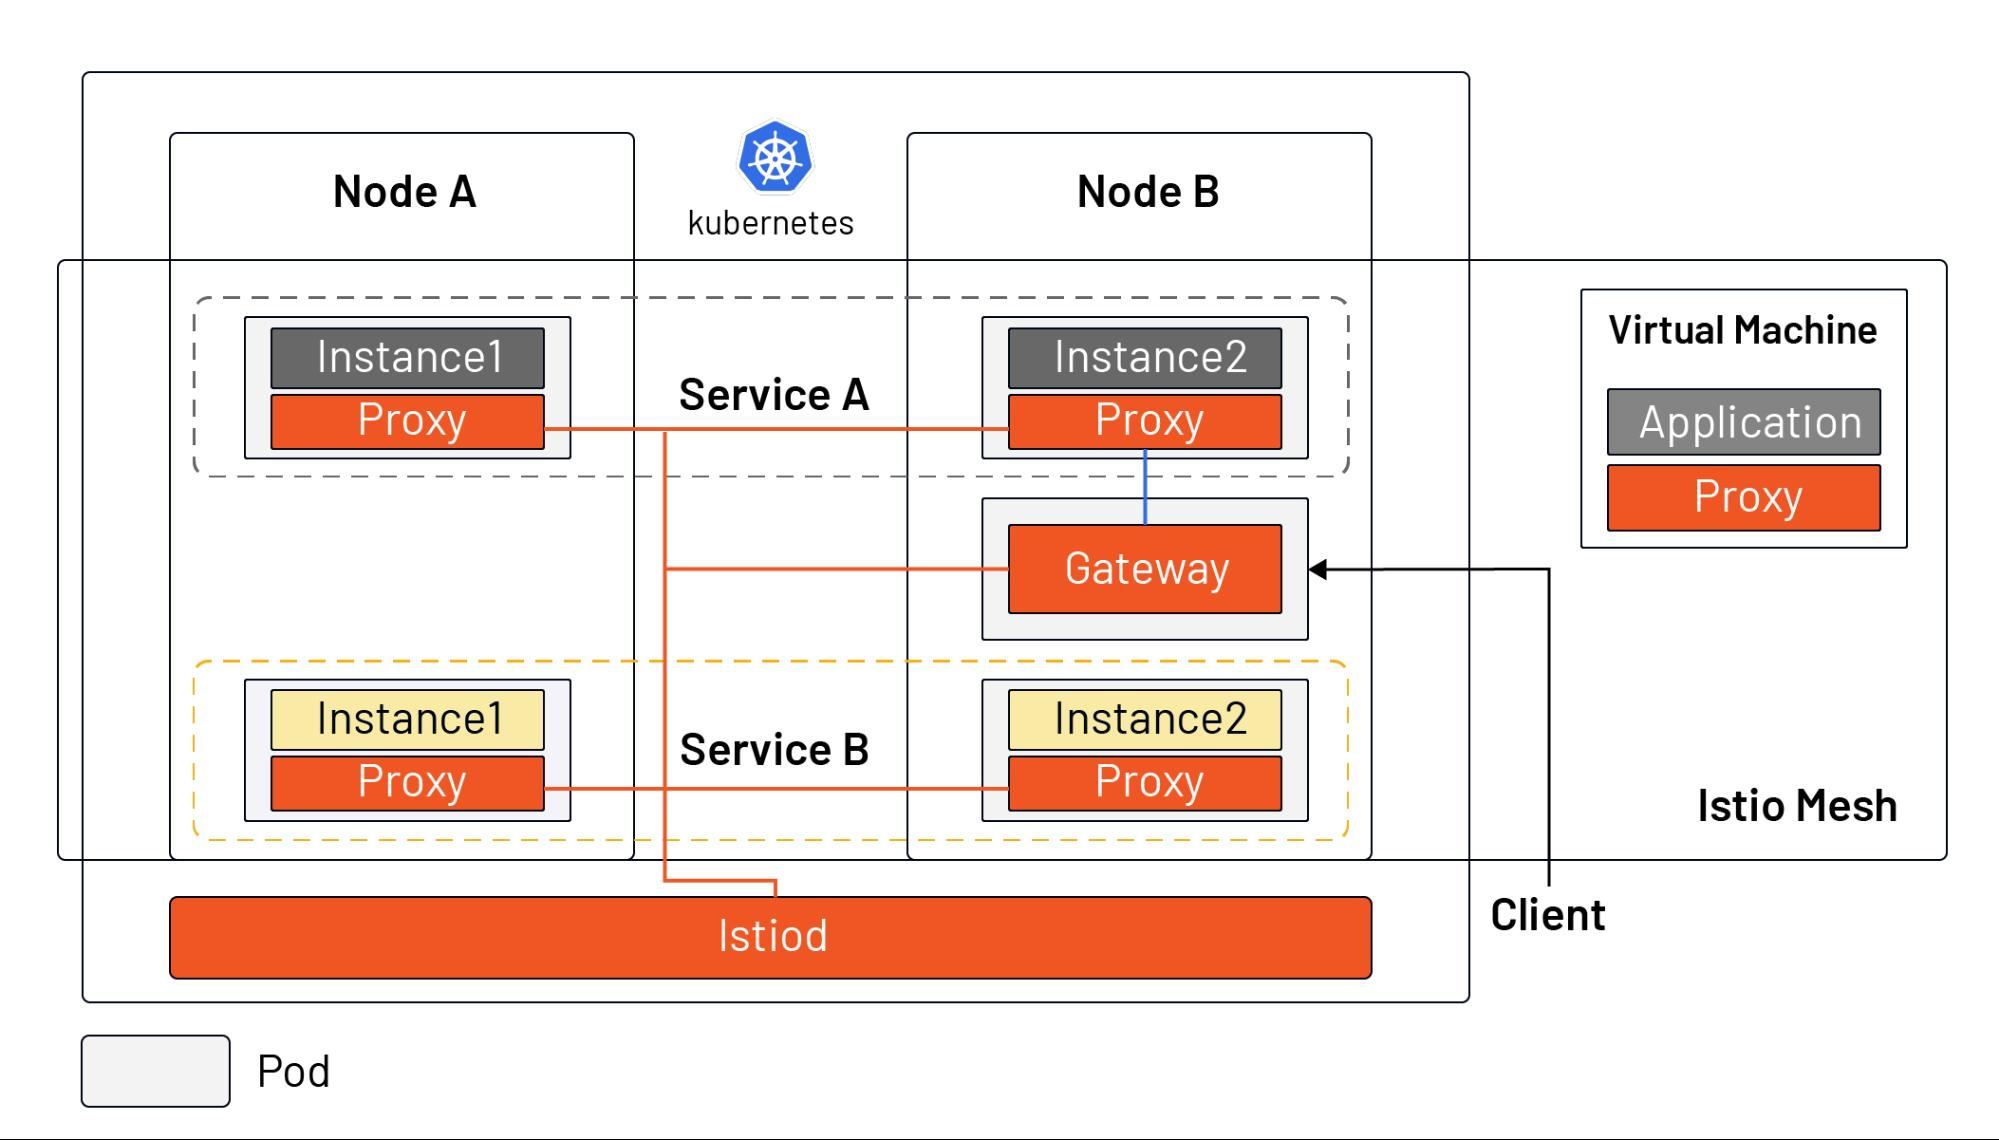
Istio Architecture:
An Istio service mesh is logically split into a data plane and a control plane.
- The data plane is composed of a set of intelligent proxies (Envoy) deployed as sidecars. These proxies mediate and control all network communication between microservices. They also collect and report telemetry on all mesh traffic.
- The control plane manages and configures the proxies to route traffic.
Key Use Cases of Istio:
- Traffic Management: Istio enables sophisticated traffic routing and load balancing, such as canary releases, A/B testing, and blue-green deployments.
- Security: It provides authentication, authorization, and encryption for service-to-service communication, enhancing the overall security of your microservices.
- Observability: Istio offers powerful tools for monitoring, tracing, and logging, which help in diagnosing issues, understanding performance, and maintaining a healthy application.
- Resilience: Istio can automatically retry failed requests, handle timeouts, and implement circuit breaking to improve the overall reliability of microservices.
Simple Examples:
- Traffic Routing: Imagine you have a web application with a new feature. You can use Istio to gradually send a percentage of user traffic to the new feature, allowing you to test it with a subset of users before a full rollout.
- Security: Istio can ensure that only authenticated services can communicate with each other. You can demonstrate this by creating policies that deny communication between services unless they meet specific authentication requirements.
- Observability: You can show how Istio generates telemetry data and integrates with tools like Grafana and Prometheus to monitor service performance and troubleshoot issues.
Why to use Istio?
- Fine-Grained Traffic Control: While Kubernetes provides basic load balancing and Ingress controllers, Istio offers more advanced traffic control. With Istio, you can perform complex routing, such as canary releases, A/B testing, and gradual deployments, which Kubernetes Ingress may not handle as flexibly.
- Security: Istio provides robust security features, including mutual TLS (mTLS) authentication between microservices. This ensures secure communication, which might not be as comprehensive in a basic Kubernetes setup.
- Observability: Istio offers advanced observability features, including metrics, distributed tracing, and logging, which are valuable for diagnosing issues and understanding performance. While Kubernetes provides some observability, Istio enhances it significantly.
https://istio.io/latest/docs/concepts/traffic-management/
When not to use Istio
- Simplicity: If you have a simple, monolithic application or a small-scale microservices setup, the overhead of configuring and managing Istio may outweigh its benefits. Simpler solutions like basic Kubernetes ingress controllers or a lightweight proxy can suffice.
- Learning Curve: Istio has a steep learning curve, which may be challenging for teams new to microservices or containers. If your team lacks the necessary expertise, you might consider simpler alternatives.
- Resource Overhead: The sidecar proxies deployed with Istio can consume additional resources, which may be a concern in resource-constrained environments. This overhead may not be justified for smaller applications.
What is a Service Mesh? https://www.redhat.com/en/topics/microservices/what-is-a-service-mesh
Istio Installation on EKS Cluster
We’re going to use HELM to install Istio
istio_chart_url     = "https://istio-release.storage.googleapis.com/charts"
istio_chart_version = "1.19.1"
helm repo add istio https://istio-release.storage.googleapis.com/charts
helm repo updatekubectl create namespace istio-systemhelm install istio-base istio/base -n istio-system --set defaultRevision=defaulthelm install istiod istio/istiod -n istio-system --waitkubectl create namespace istio-ingressIts important to set the correct annotations so the ALB can be allocated
helm install istio-ingress istio/gateway -n istio-ingress \
	--set "labels.istio=ingressgateway" \
  --set service.annotations."service\.beta\.kubernetes\.io/aws-load-balancer-type"="nlb" \
  --set service.annotations."service\.beta\.kubernetes\.io/aws-load-balancer-scheme"="internet-facing" \
  --set service.annotations."service\.beta\.kubernetes\.io/aws-load-balancer-attributes"="load_balancing.cross_zone.enabled=true" \
  --wait
helm ls -n istio-system
helm ls -n istio-ingress❯ helm ls -A
NAME NAMESPACE REVISION UPDATED STATUS CHART APP VERSION
istio-base istio-system 1 2023-10-11 23:09:52.890167 +0530 IST deployed base-1.19.1 1.19.1
istio-ingress istio-ingress 1 2023-10-11 23:10:30.631913 +0530 IST deployed gateway-1.19.1 1.19.1
istiod istio-system 1 2023-10-11 23:10:05.03971 +0530 IST deployed istiod-1.19.1 1.19.1kubectl rollout restart deployment istio-ingress -n istio-ingressfor ADDON in kiali jaeger prometheus grafana
do
ADDON_URL="https://raw.githubusercontent.com/istio/istio/release-1.18/samples/addons/$ADDON.yaml"
kubectl apply -f $ADDON_URL
done# Visualize Istio Mesh console using Kiali
kubectl port-forward svc/kiali 20001:20001 -n istio-system
# Get to the Prometheus UI
kubectl port-forward svc/prometheus 9090:9090 -n istio-system
# Visualize metrics in using Grafana
kubectl port-forward svc/grafana 3000:3000 -n istio-systemkubectl get pods,svc -n istio-system
kubectl get pods,svc -n istio-ingress❯ kubectl get pods,svc -n istio-system
NAME READY STATUS RESTARTS AGE
pod/grafana-5f98b97b64-mrlzg 1/1 Running 0 25s
pod/istiod-5b4f9c79cd-pgnxf 1/1 Running 0 15m
pod/jaeger-76cd7c7566-htt97 1/1 Running 0 29s
pod/kiali-7799445c94-s7w67 0/1 Running 0 30s
pod/prometheus-67599c8d5c-6lgc4 2/2 Running 0 27s
NAME TYPE CLUSTER-IP EXTERNAL-IP PORT(S) AGE
service/grafana ClusterIP 10.100.49.218 <none> 3000/TCP 25s
service/istiod ClusterIP 10.100.152.74 <none> 15010/TCP,15012/TCP,443/TCP,15014/TCP 15m
service/jaeger-collector ClusterIP 10.100.194.82 <none> 14268/TCP,14250/TCP,9411/TCP 28s
service/kiali ClusterIP 10.100.119.184 <none> 20001/TCP,9090/TCP 30s
service/prometheus ClusterIP 10.100.208.254 <none> 9090/TCP 27s
service/tracing ClusterIP 10.100.177.26 <none> 80/TCP,16685/TCP 28s
service/zipkin ClusterIP 10.100.152.22 <none> 9411/TCP 28s
❯ kubectl get pods,svc -n istio-ingress
NAME READY STATUS RESTARTS AGE
pod/istio-ingress-858849b544-q76zv 1/1 Running 0 2m10s
NAME TYPE CLUSTER-IP EXTERNAL-IP PORT(S) AGE
service/istio-ingress LoadBalancer 10.100.126.187 a1d0c80c1a69f45ef8e47770bc9046b3-fea2a1b381192a02.elb.ap-south-1.amazonaws.com 15021:32125/TCP,80:30181/TCP,443:30285/TCP 2m10sEnable SideCar Injection
kubectl label namespace default istio-injection=enabled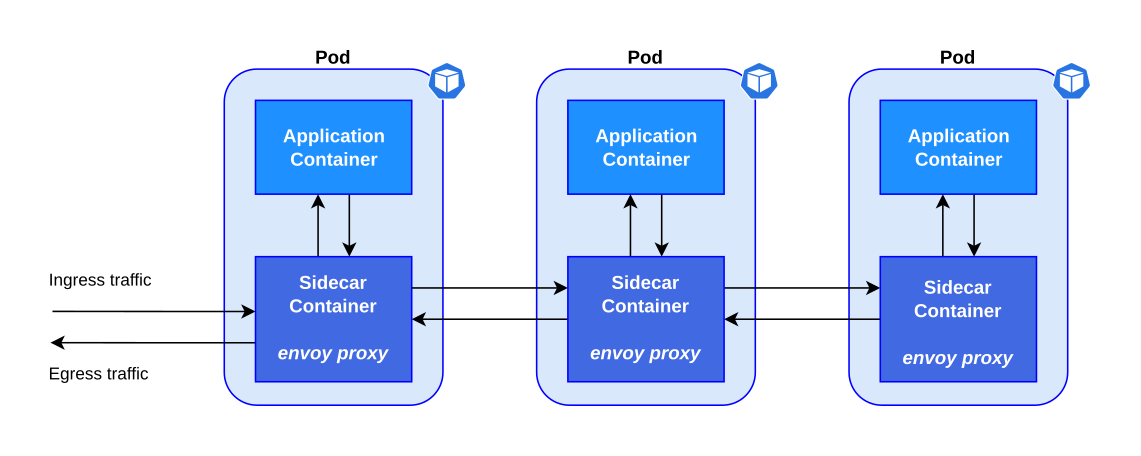
Install the Gateway CRDs
kubectl get crd gateways.gateway.networking.k8s.io &> /dev/null || \
  { kubectl kustomize "github.com/kubernetes-sigs/gateway-api/config/crd?ref=v0.8.0" | kubectl apply -f -; }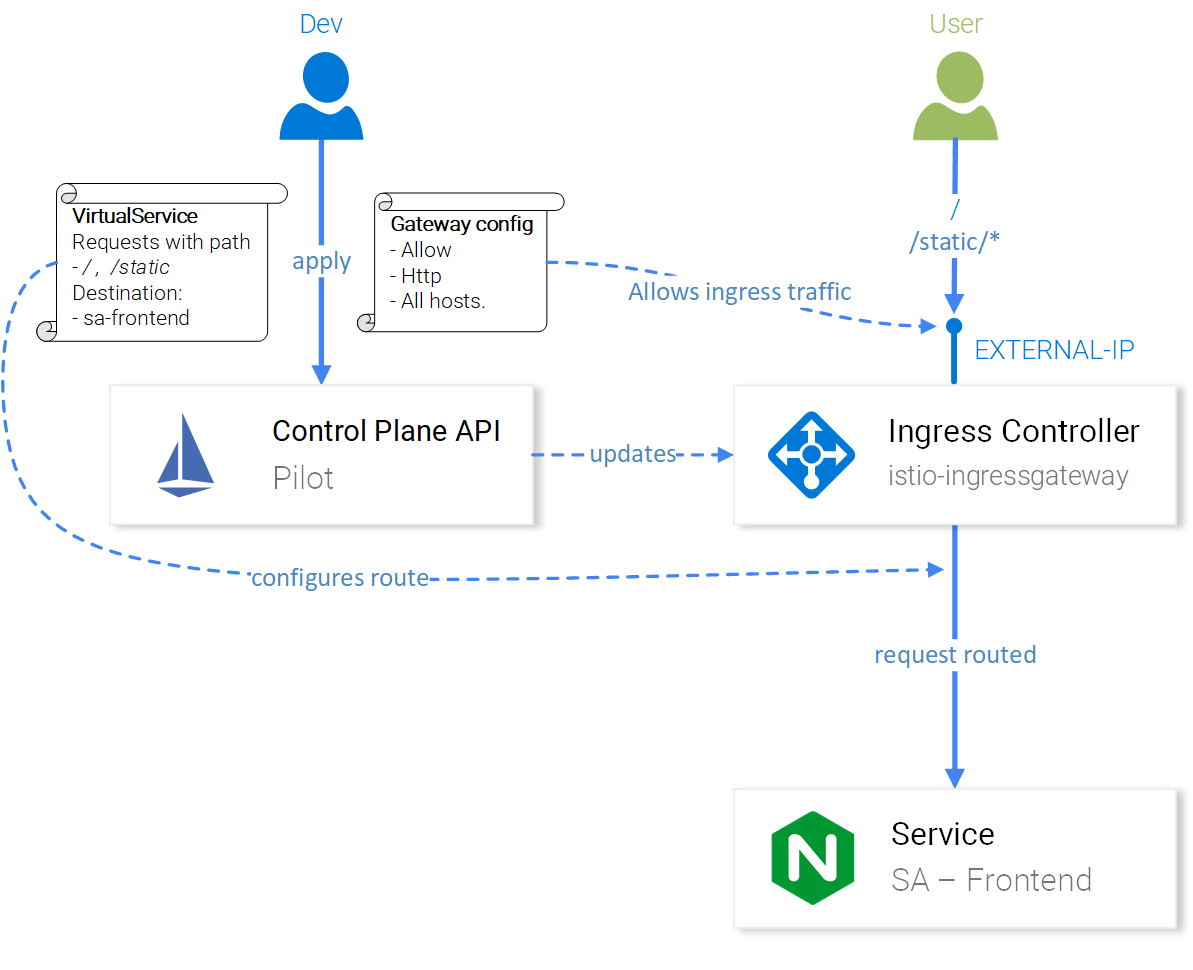
Testing out Istio Installation
Test ISTIO Installation with the BookInfo Example
k apply -f https://raw.githubusercontent.com/istio/istio/release-1.19/samples/bookinfo/platform/kube/bookinfo.yamlWe can hit the bookinfo endpoint
kubectl exec "$(kubectl get pod -l app=ratings -o jsonpath='{.items[0].metadata.name}')" -c ratings -- curl -sS productpage:9080/productpage | grep -o "<title>.*</title>"Install the bookinfo gateway
k apply -f https://raw.githubusercontent.com/istio/istio/release-1.19/samples/bookinfo/gateway-api/bookinfo-gateway.yamlNow we need to figure out the Gateway URL which we can hit
export INGRESS_HOST=$(kubectl get gtw bookinfo-gateway -o jsonpath='{.status.addresses[0].value}')
export INGRESS_PORT=$(kubectl get gtw bookinfo-gateway -o jsonpath='{.spec.listeners[?(@.name=="http")].port}')
export GATEWAY_URL=$INGRESS_HOST:$INGRESS_PORT
❯ kubectl get gtw bookinfo-gateway
NAME CLASS ADDRESS PROGRAMMED AGE
bookinfo-gateway istio a3693488f6dff4e6b8d8af550ca23e38-1100175332.us-west-2.elb.amazonaws.com True 49sYou can get the LoadBalancer URL from service as well
k get svccurl -s "http://${GATEWAY_URL}/productpage" | grep -o "<title>.*</title>"echo "http://${GATEWAY_URL}/productpage"KServe
KServe is an open-source framework designed to streamline the deployment and serving of machine learning models on Kubernetes. It simplifies the process of deploying models for inference in production environments.
KServe is specifically tailored for serving machine learning models efficiently and scalably on Kubernetes. It simplifies the operational aspects of ML model serving, allowing data scientists and ML engineers to focus on their models while taking advantage of Kubernetes' flexibility and scaling capabilities.
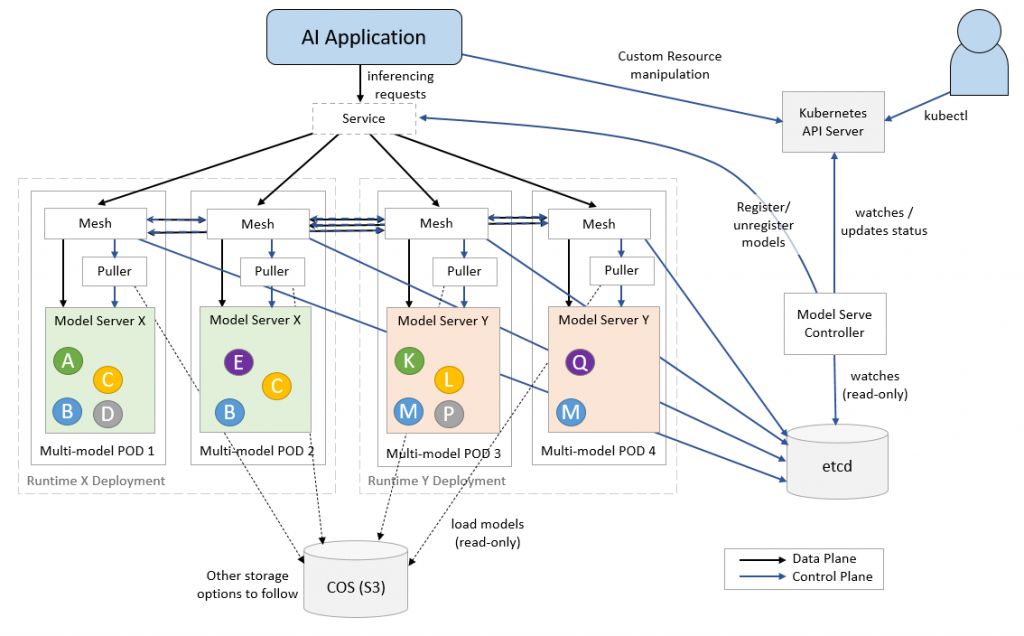
KServe Architecture

KServe's architecture has a control plane and a data plane. The control plane manages model deployments, creating service endpoints, handling scaling, and connecting to model storage (like cloud storage).
The data plane processes requests and responses for specific models. It includes the predictor for inference, the transformer for data processing, and optionally, an explainer for model explainability.
Components:
- KServe Controller: Manages the lifecycle of model deployments, including creating services, ingresses, containers, and model agent containers for logging and batching.
- Model Store: A repository for registered models, usually cloud-based (e.g., Amazon S3, Google Cloud Storage).
- Predictor: Receives inference requests and invokes the transformer for data processing and, optionally, the explainer for model explainability.
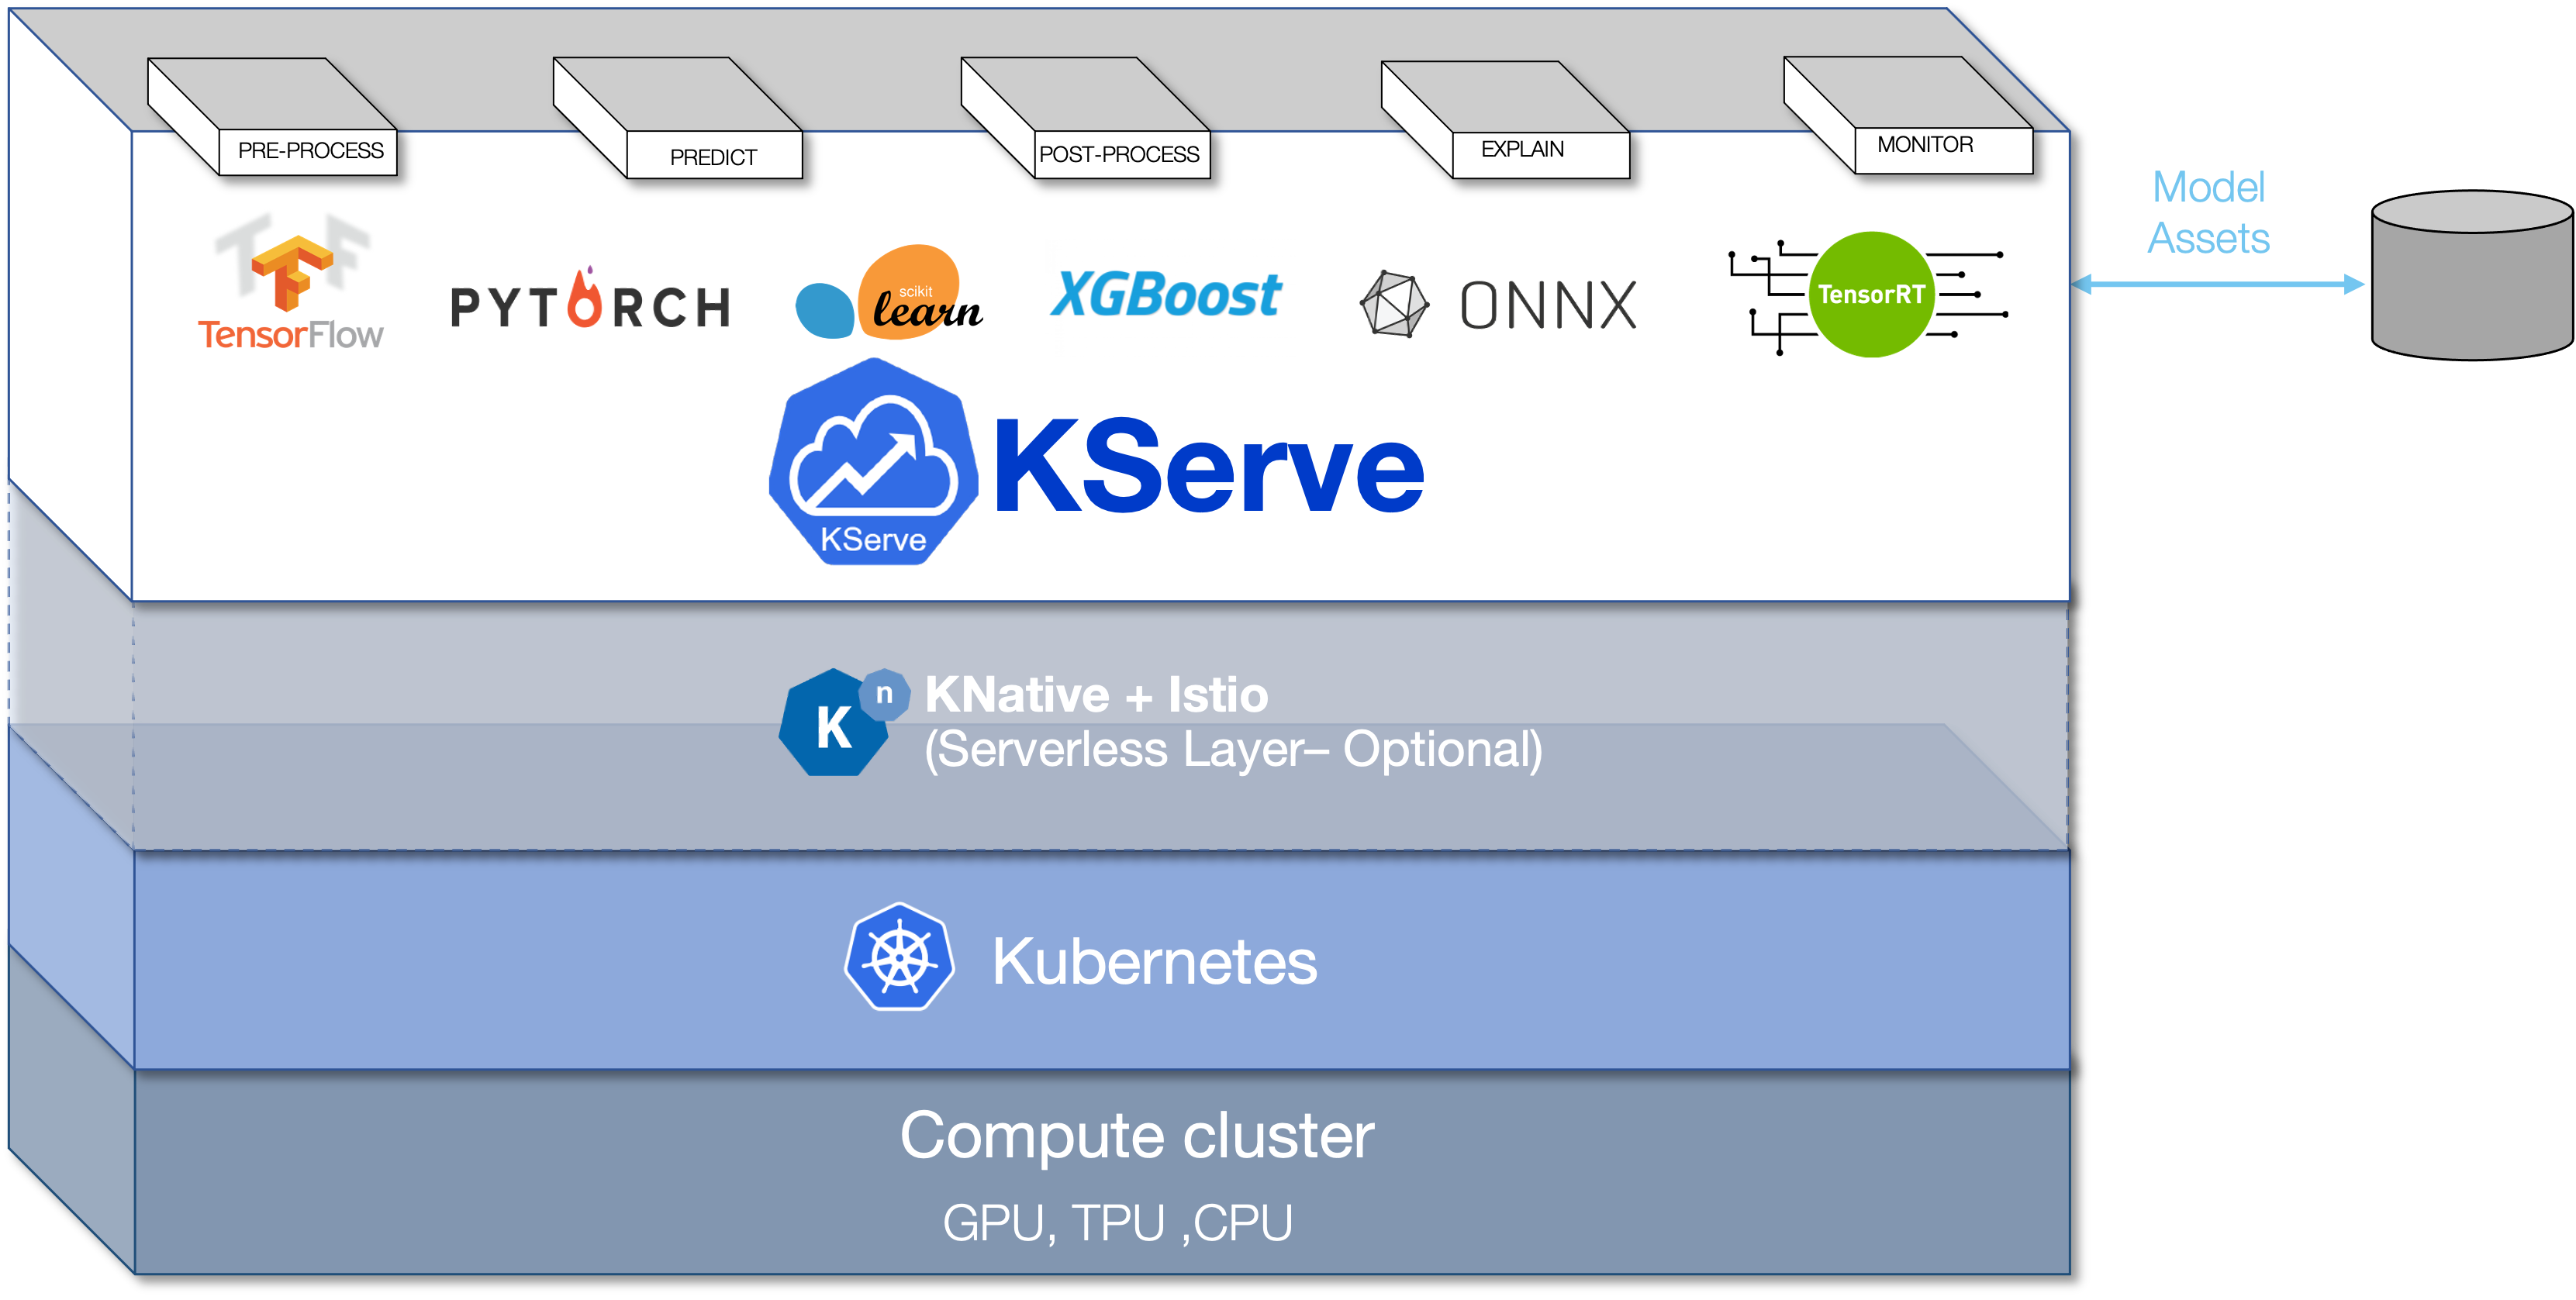
Supported Frameworks and Runtimes:
KServe supports various machine learning and deep learning frameworks, including TensorFlow, ONNX, PyTorch, and more. It also works with classical ML models based on SKLearn, XGBoost, and others. You can even extend KServe to support custom runtimes that follow the V2 inference protocol.
KServe Model Mesh
Installing KServe
https://kserve.github.io/website/0.11/admin/kubernetes_deployment/
We need to create an istio ingress class which will be used by KServe
istio-kserve-ingress.yaml
apiVersion: networking.k8s.io/v1
kind: IngressClass
metadata:
  name: istio
spec:
  controller: istio.io/ingress-controller
k apply -f istio-kserve-ingress.yamlInstall the Metrics API
https://docs.aws.amazon.com/eks/latest/userguide/metrics-server.html
kubectl apply -f https://github.com/kubernetes-sigs/metrics-server/releases/latest/download/components.yamlInstall Cert Manager
kubectl apply -f https://github.com/cert-manager/cert-manager/releases/download/v1.13.1/cert-manager.yamlInstall KServe Manifest
kubectl apply -f https://github.com/kserve/kserve/releases/download/v0.11.0/kserve.yamlKServe Runtime
kubectl apply -f https://github.com/kserve/kserve/releases/download/v0.11.0/kserve-runtimes.yamlkubectl patch configmap/inferenceservice-config -n kserve --type=strategic -p '{"data": {"deploy": "{\"defaultDeploymentMode\": \"RawDeployment\"}"}}'Test KServe Installation
We can deploy the IRIS Example to test the KServe Installation
iris.yaml
apiVersion: "serving.kserve.io/v1beta1"
kind: "InferenceService"
metadata:
  name: "sklearn-iris"
spec:
  predictor:
    model:
      modelFormat:
        name: sklearn
      storageUri: "gs://kfserving-examples/models/sklearn/1.0/model"
iris-input.json
{
  "instances": [
    [6.8,  2.8,  4.8,  1.4],
    [6.0,  3.4,  4.5,  1.6]
  ]
}
Install iris inference service
k apply -f iris.yamlkubectl get inferenceservices sklearn-iris❯ kubectl get inferenceservices sklearn-iris
NAME URL READY PREV LATEST PREVROLLEDOUTREVISION LATESTREADYREVISION AGE
sklearn-iris http://sklearn-iris-default.example.com True 2m51sSERVICE_HOSTNAME=$(kubectl get inferenceservice sklearn-iris -o jsonpath='{.status.url}' | cut -d "/" -f 3)sklearn-iris-predictor-78cc5dd598-njsjw 2/2 Running 0 92sNow we need the Ingress URL to hit the iris endpoint
export INGRESS_HOST=$(kubectl -n istio-ingress get service istio-ingress -o jsonpath='{.status.loadBalancer.ingress[0].hostname}')
export INGRESS_PORT=$(kubectl -n istio-ingress get service istio-ingress -o jsonpath='{.spec.ports[?(@.name=="http2")].port}')
echo $INGRESS_HOST:$INGRESS_PORT❯ echo $INGRESS_HOST:$INGRESS_PORT
a93c9a652530148ba8bf451bf39605f3-7dcc8712d84cd905.elb.us-west-2.amazonaws.com:80curl -v -H "Host: ${SERVICE_HOSTNAME}" -H "Content-Type: application/json" "http://${INGRESS_HOST}:${INGRESS_PORT}/v1/models/sklearn-iris:predict" -d @./iris-input.json❯ curl -v -H "Host: ${SERVICE_HOSTNAME}" -H "Content-Type: application/json" "http://${INGRESS_HOST}:${INGRESS_PORT}/v1/models/sklearn-iris:predict" -d @./iris-input.json
* Trying 43.204.68.180:80...
* Connected to a1d0c80c1a69f45ef8e47770bc9046b3-fea2a1b381192a02.elb.ap-south-1.amazonaws.com (43.204.68.180) port 80 (#0)
> POST /v1/models/sklearn-iris:predict HTTP/1.1
> Host: sklearn-iris-default.example.com
> User-Agent: curl/8.1.2
> Accept: */*
> Content-Type: application/json
> Content-Length: 170
>
< HTTP/1.1 200 OK
< date: Tue, 10 Oct 2023 17:07:43 GMT
< server: istio-envoy
< content-length: 23
< content-type: application/json
< x-envoy-upstream-service-time: 3
<
* Connection #0 to host a1d0c80c1a69f45ef8e47770bc9046b3-fea2a1b381192a02.elb.ap-south-1.amazonaws.com left intact
{"predictions":[2,1,1]}So we have successfully installed KServe!
S3 Access for KServe
Enable OIDC if not done already
eksctl utils associate-iam-oidc-provider --region ap-south-1 --cluster basic-cluster --approveCreate IRSA for S3 Read Only Access
eksctl create iamserviceaccount \
	--cluster=basic-cluster \
	--name=s3-read-only \
	--attach-policy-arn=arn:aws:iam::aws:policy/AmazonS3ReadOnlyAccess \
	--override-existing-serviceaccounts \
	--region ap-south-1 \
	--approve
Create S3 Secret to be used by our Inference Service
s3-secret.yaml
apiVersion: v1
kind: Secret
metadata:
  name: s3-secret
  annotations:
    serving.kserve.io/s3-endpoint: s3.amazonaws.com # replace with your s3 endpoint e.g minio-service.kubeflow:9000
    serving.kserve.io/s3-usehttps: "1" # by default 1, if testing with minio you can set to 0
    serving.kserve.io/s3-region: "ap-south-1"
    serving.kserve.io/s3-useanoncredential: "false" # omitting this is the same as false, if true will ignore provided credential and use anonymous credentials
type: Opaque
k apply -f s3-secret.yamlk patch serviceaccount s3-read-only -p '{"secrets": [{"name": "s3-secret"}]}'Deploy SDXL on EKS with KServe

This deployment is going to take in the .mar files we generated in TorchServe Assignment and just deploy that over KServe!
config/config.properties
inference_address=http://0.0.0.0:8085
management_address=http://0.0.0.0:8085
metrics_address=http://0.0.0.0:8082
grpc_inference_port=7070
grpc_management_port=7071
enable_envvars_config=true
install_py_dep_per_model=true
load_models=all
max_response_size=655350000
model_store=/tmp/models
default_response_timeout=600
enable_metrics_api=true
metrics_format=prometheus
number_of_netty_threads=4
job_queue_size=10
requirement.txt
--find-links https://download.pytorch.org/whl/cu117
torch==2.0.1
torchvision
transformers==4.34.0
diffusers==0.21.4
numpy==1.26.0
omegaconf==2.3.0
accelerate==0.23.0
sdxl_handler.py
import logging
import zipfile
from abc import ABC

import numpy as np
import torch
from diffusers import StableDiffusionXLPipeline

from ts.torch_handler.base_handler import BaseHandler

logger = logging.getLogger(__name__)
logger.info("Loading sdxl_handler...")

class SDXLHandler(BaseHandler, ABC):
    def __init__(self):
        self.initialized = False

    def initialize(self, ctx):
        """In this initialize function, the Stable Diffusion model is loaded and
        initialized here.
        Args:
            ctx (context): It is a JSON Object containing information
            pertaining to the model artefacts parameters.
        """
        self.manifest = ctx.manifest
        properties = ctx.system_properties
        model_dir = properties.get("model_dir")

        logger.info(f"torch.cuda.is_available() = {torch.cuda.is_available()}")
        logger.info(f'gpu_id = {properties.get("gpu_id")}')

        self.device = torch.device(
            "cuda:" + str(properties.get("gpu_id"))
            if torch.cuda.is_available() and properties.get("gpu_id") is not None
            else "cpu"
        )

        with zipfile.ZipFile(model_dir + "/sdxl-1.0-model.zip", "r") as zip_ref:
            zip_ref.extractall(model_dir + "/model")

        self.pipe = StableDiffusionXLPipeline.from_pretrained(model_dir + "/model", torch_dtype=torch.float16, variant="fp16")
        self.pipe = self.pipe.to(self.device)
        logger.info(f"loaded StableDiffusionXL model from {model_dir}/sdxl-1.0-model.zip")

        self.initialized = True

    def preprocess(self, requests):
        """Basic text preprocessing, of the user's prompt.
        Args:
            requests (str): The Input data in the form of text is passed on to the preprocess
            function.
        Returns:
            list : The preprocess function returns a list of prompts.
        """
        inputs = []
        for _, data in enumerate(requests):
            input_text = data.get("data")
            if input_text is None:
                input_text = data.get("body")
            if isinstance(input_text, (bytes, bytearray)):
                input_text = input_text.decode("utf-8")
            logger.info("received text: '%s'", input_text)
            inputs.append(input_text)
        return inputs

    def inference(self, inputs):
        """Generates the image relevant to the received text.
        Args:
            input_batch (list): List of Text from the pre-process function is passed here
        Returns:
            list : It returns a list of the generate images for the input text
        """
        inferences = self.pipe(
            inputs, num_inference_steps=50, height=1024, width=1024
        ).images

        logger.info(f"generated images: {inferences}")
        return inferences

    def postprocess(self, inference_output):
        """Post Process Function converts the generated image into Torchserve readable format.
        Args:
            inference_output (list): It contains the generated image of the input text.
        Returns:
            (list): Returns a list of the images.
        """
        images = []
        for image in inference_output:
            images.append(np.array(image).tolist())
        return images
Now we need to start a torchserve docker container to create the model archive file
docker run -it --rm --shm-size=1g --ulimit memlock=-1 --ulimit stack=67108864 --gpus all -v `pwd`:/opt/src pytorch/torchserve:0.8.1-gpu bashCreate MAR from handler and model artifact
cd /opt/src
torch-model-archiver --model-name sdxl --version 1.0 --handler sdxl_handler.py --extra-files sdxl-1.0-model.zip -r requirements.txt
This will create sdxl.mar
Create a S3 Bucket where we will store these model .mar files, which will be loaded by KServe
❯ aws s3 cp config.properties s3://pytorch-models/config/
upload: ./config.properties to s3://pytorch-models/config/config.properties
aws s3 cp sdxl.mar s3://pytorch-models/model-store/Deploy SDXL!
sdxl.yaml
apiVersion: "serving.kserve.io/v1beta1"
kind: "InferenceService"
metadata:
  name: "torchserve"
spec:
  predictor:
    serviceAccountName: s3-read-only
    model:
      modelFormat:
        name: pytorch
      storageUri: s3://pytorch-fr-models
      resources:
        limits:
          memory: 4Gi
          nvidia.com/gpu: "1"
Make sure serviceAccountName is correct!
k apply -f sdxl.yaml❯ k apply -f sdxl.yaml
inferenceservice.serving.kserve.io/torchserve createdIt will start the torchserve predictor pod
❯ kgpo
NAME                                    READY   STATUS     RESTARTS      AGE
torchserve-predictor-69d746c8dc-2sptp   0/2     Init:0/2   1 (52s ago)   79s
klo torchserve-predictor-69d746c8dc-wqnw9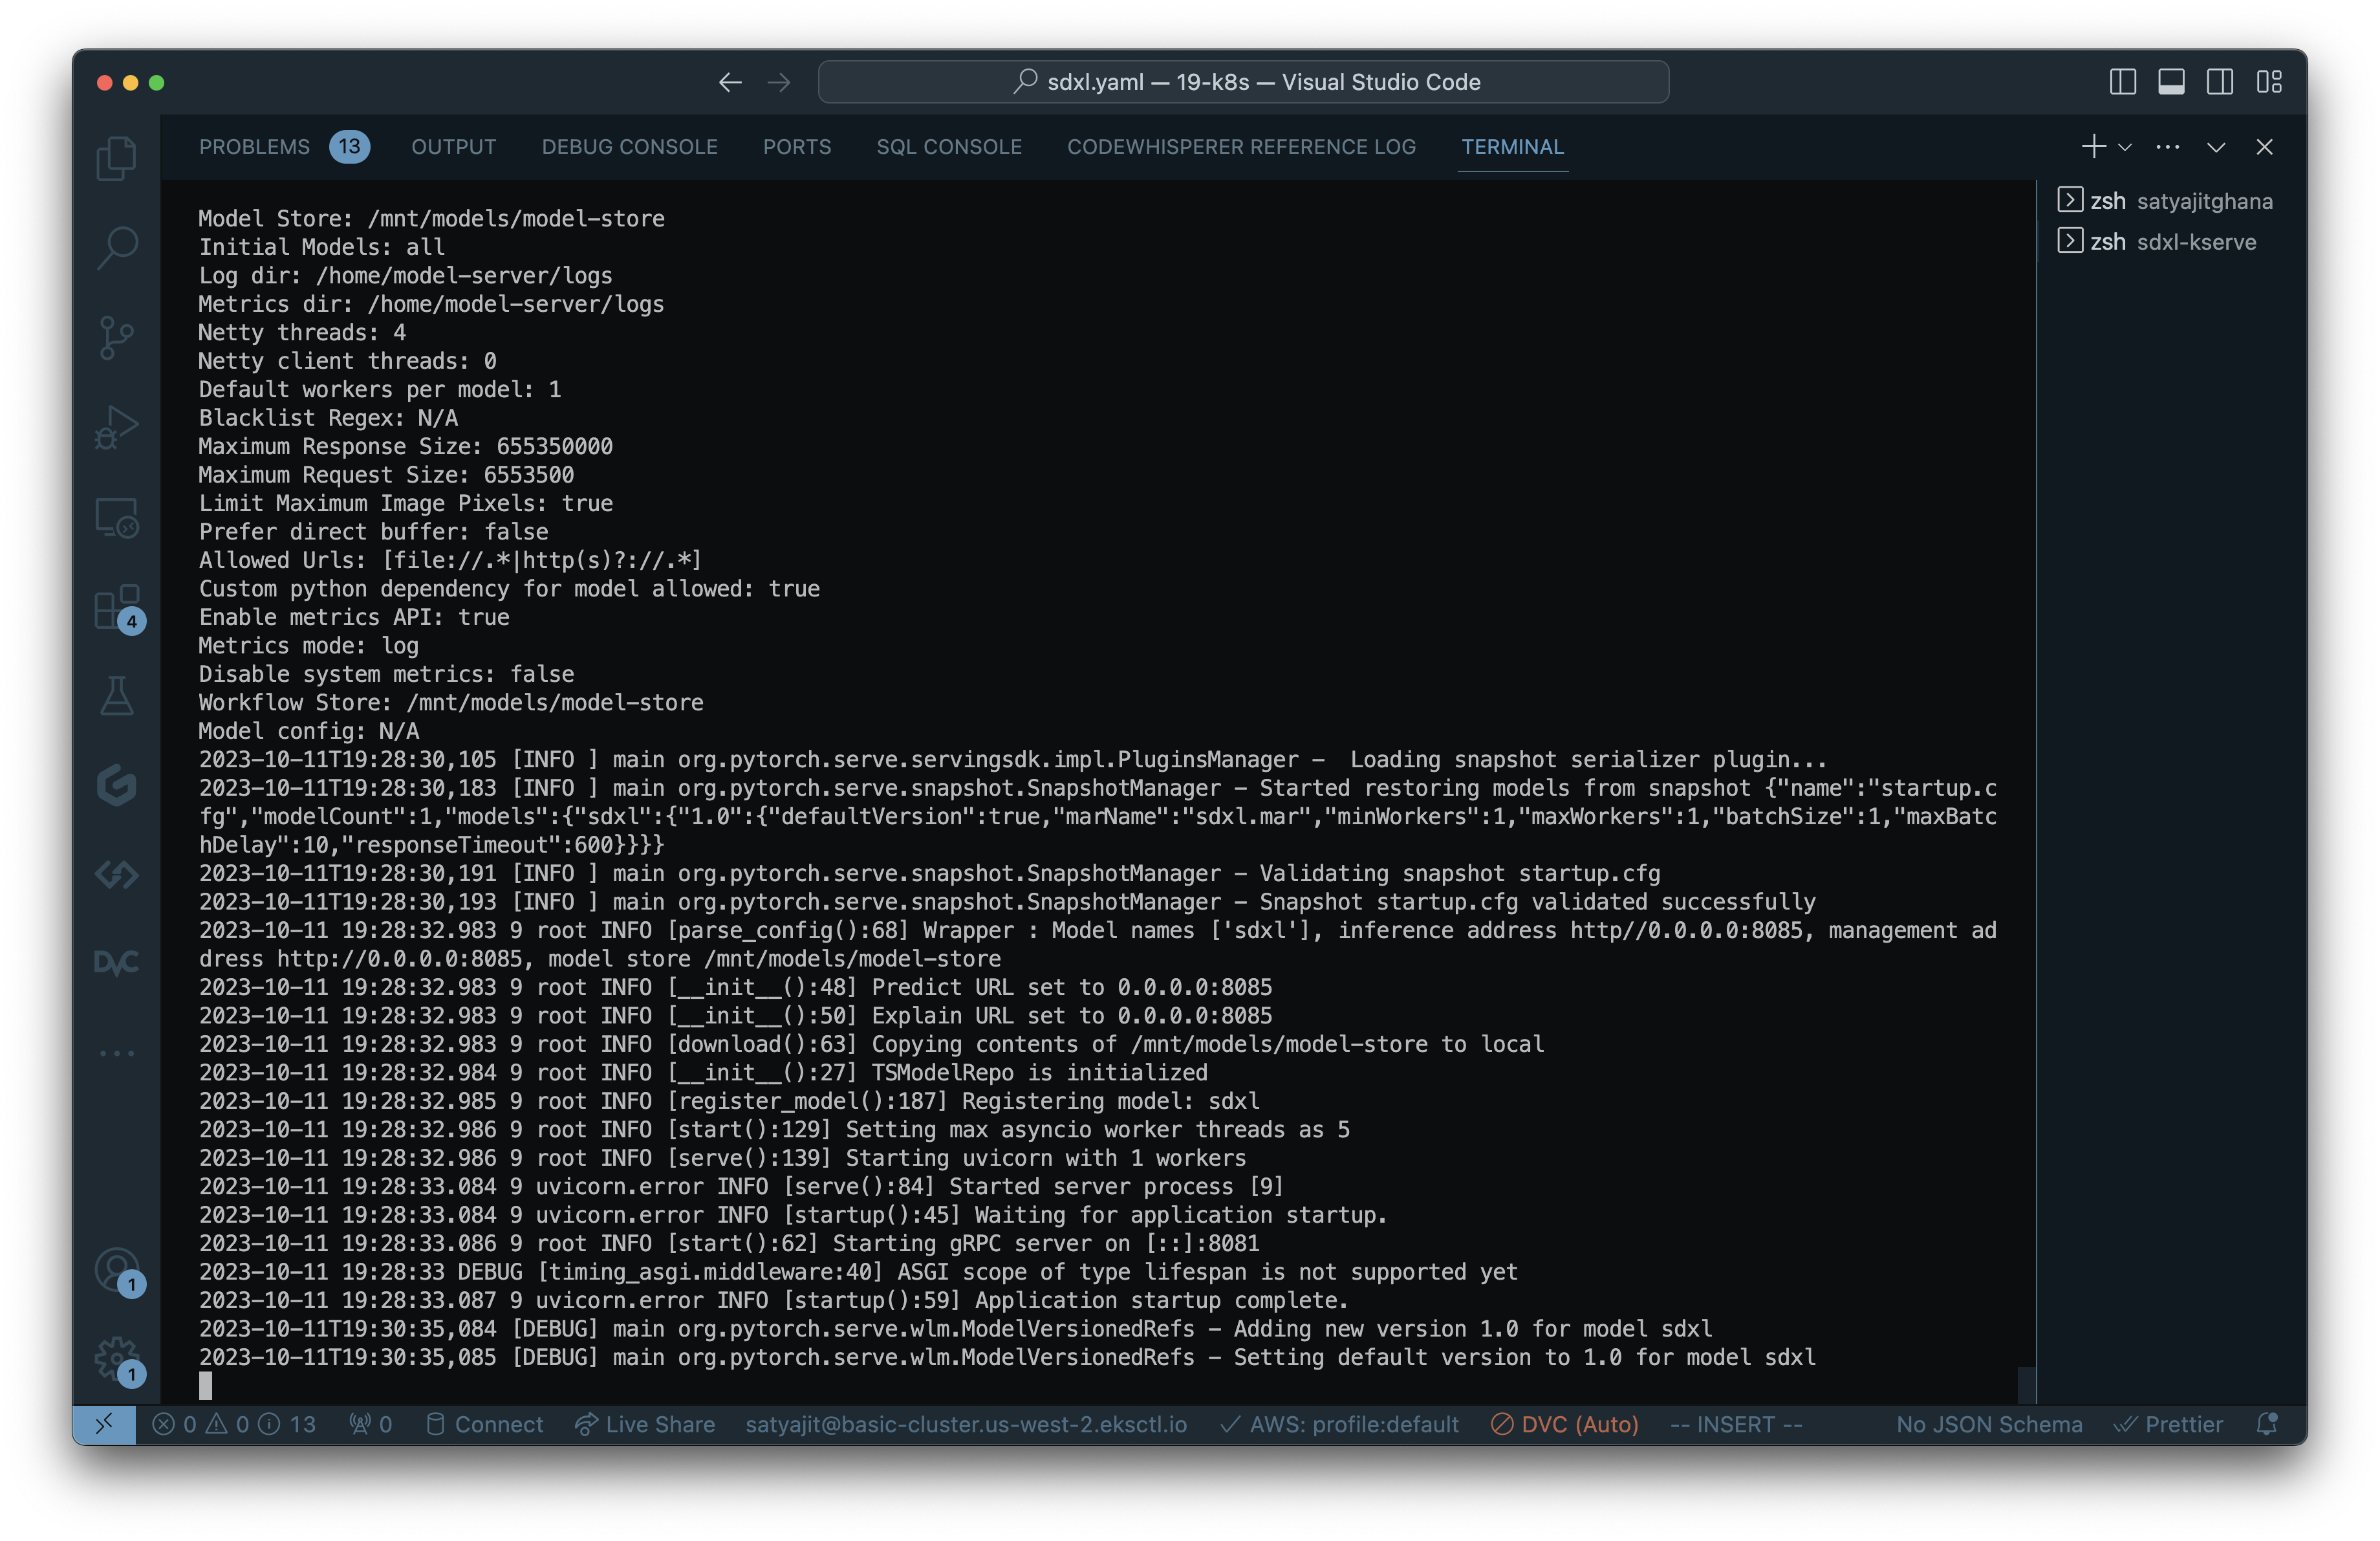
Once created you will get a url for your inferenceservice
❯ kg isvc
NAME           URL                                       READY   PREV   LATEST   PREVROLLEDOUTREVISION   LATESTREADYREVISION   AGE
sklearn-iris   http://sklearn-iris-default.example.com   True                                                                  169m
torchserve     http://torchserve-default.example.com     True                                                                  6m13s
Now we need to figure out how do we access this model
export INGRESS_HOST=$(kubectl -n istio-ingress get service istio-ingress -o jsonpath='{.status.loadBalancer.ingress[0].hostname}')
export INGRESS_PORT=$(kubectl -n istio-ingress get service istio-ingress -o jsonpath='{.spec.ports[?(@.name=="http2")].port}')MODEL_NAME=sdxl
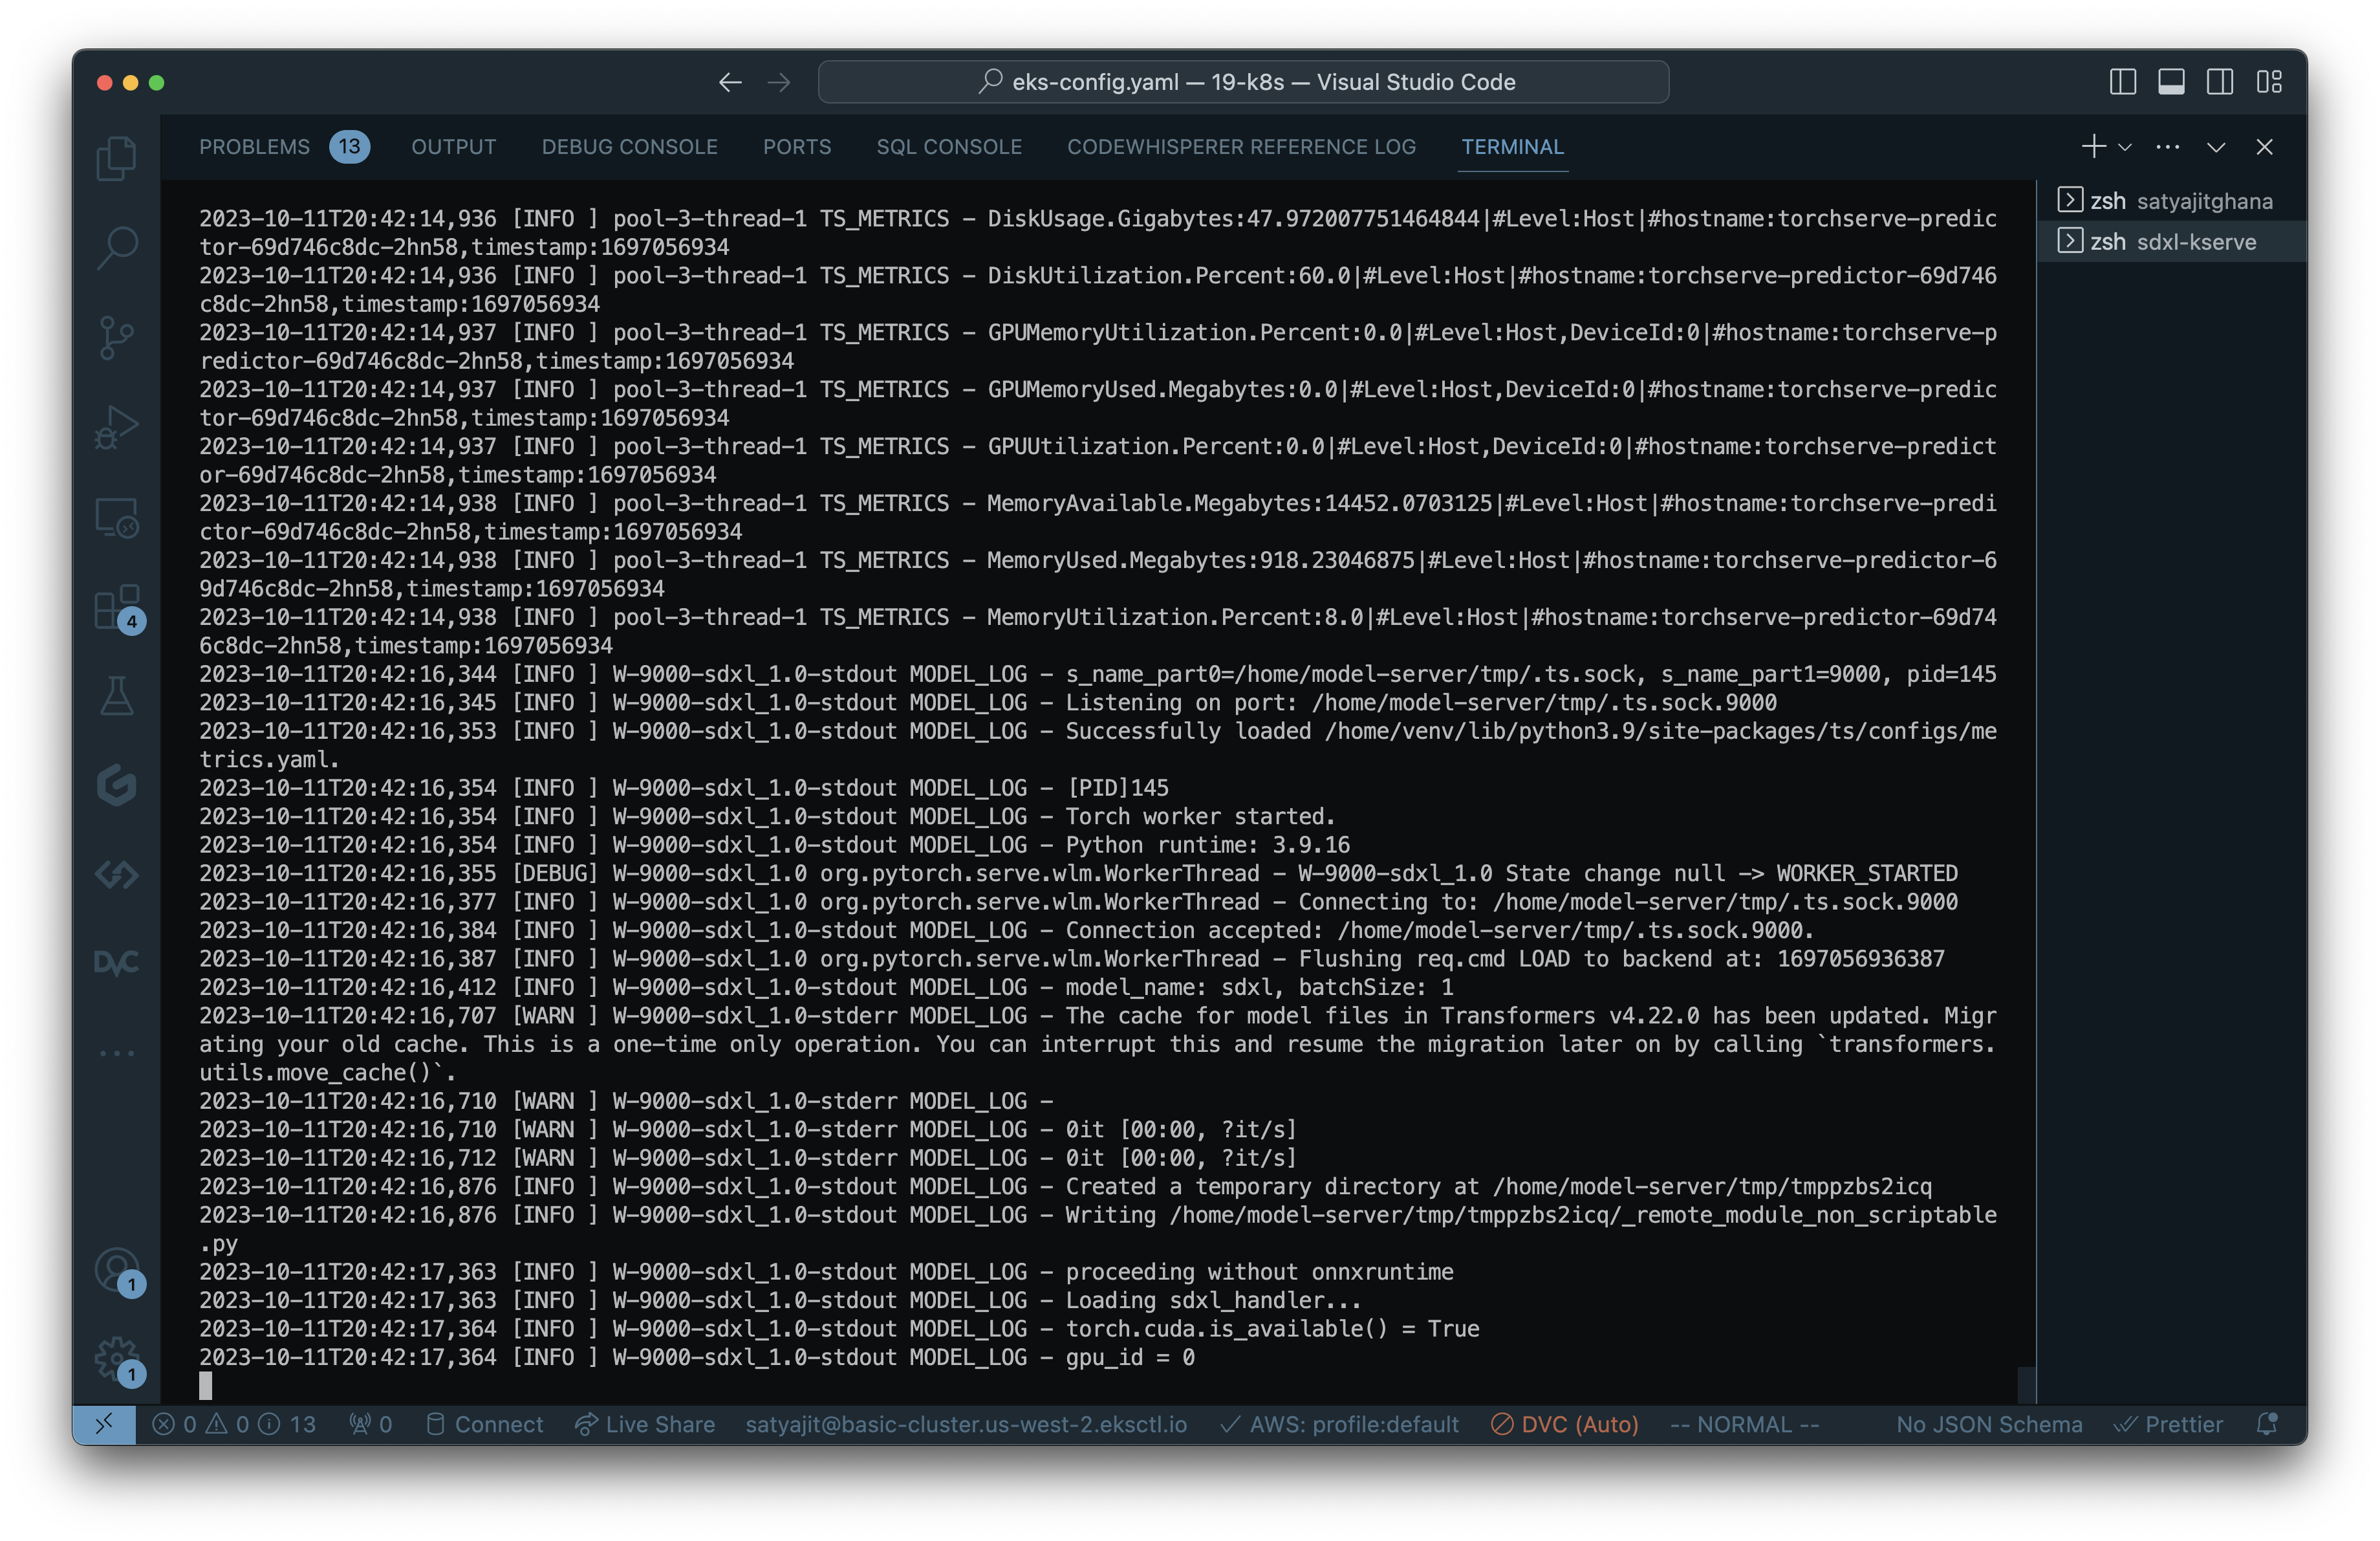
SERVICE_HOSTNAME=$(kubectl get inferenceservice torchserve -o jsonpath='{.status.url}' | cut -d "/" -f 3)curl -v -H "Host: ${SERVICE_HOSTNAME}" http://${INGRESS_HOST}:${INGRESS_PORT}/v1/models/${MODEL_NAME}:predict -d @./input.jsonWe can always SSH into our GPU Node to see what’s happening
sh-4.2$ nvidia-smi
Wed Oct 11 20:54:12 2023
+-----------------------------------------------------------------------------+
| NVIDIA-SMI 470.182.03   Driver Version: 470.182.03   CUDA Version: 11.4     |
|-------------------------------+----------------------+----------------------+
| GPU  Name        Persistence-M| Bus-Id        Disp.A | Volatile Uncorr. ECC |
| Fan  Temp  Perf  Pwr:Usage/Cap|         Memory-Usage | GPU-Util  Compute M. |
|                               |                      |               MIG M. |
|===============================+======================+======================|
|   0  Tesla T4            On   | 00000000:00:1E.0 Off |                    0 |
| N/A   57C    P0    72W /  70W |  13750MiB / 15109MiB |    100%      Default |
|                               |                      |                  N/A |
+-------------------------------+----------------------+----------------------+

+-----------------------------------------------------------------------------+
| Processes:                                                                  |
|  GPU   GI   CI        PID   Type   Process name                  GPU Memory |
|        ID   ID                                                   Usage      |
|=============================================================================|
|    0   N/A  N/A    119154      C   /home/venv/bin/python           13747MiB |
+-----------------------------------------------------------------------------+
❯ echo http://${INGRESS_HOST}:${INGRESS_PORT}/v1/models/${MODEL_NAME}:predict
http://aee0d8fb7d6514f87a04ac80d194f1b3-c98fee301a70a638.elb.us-west-2.amazonaws.com:80/v1/models/sdxl:predictPython Script to hit the inference endpoint and saving the results
test_kserve.py
import requests
import json
import numpy as np

from PIL import Image

input = {
	"instances": [
		{
			"data": "a cat on a farm"
		}
	]
}

headers= {
	"Host": "torchserve-default.example.com"
}

url = "http://a93c9a652530148ba8bf451bf39605f3-7dcc8712d84cd905.elb.us-west-2.amazonaws.com:80/v1/models/sdxl:predict"

response = requests.post(url, data=json.dumps(input), headers=headers)

# with open("raw.txt", "w") as f:
# 	f.write(response.text)

# with open("raw.txt", "r") as f:
# 	a = f.read()

image = Image.fromarray(np.array(json.loads(response.text)['predictions'][0], dtype="uint8"))
image.save("out.jpg")
python test_kserve.py


That’s it ! We have deployed SDXL on KServe on Kubernetes on EKS !
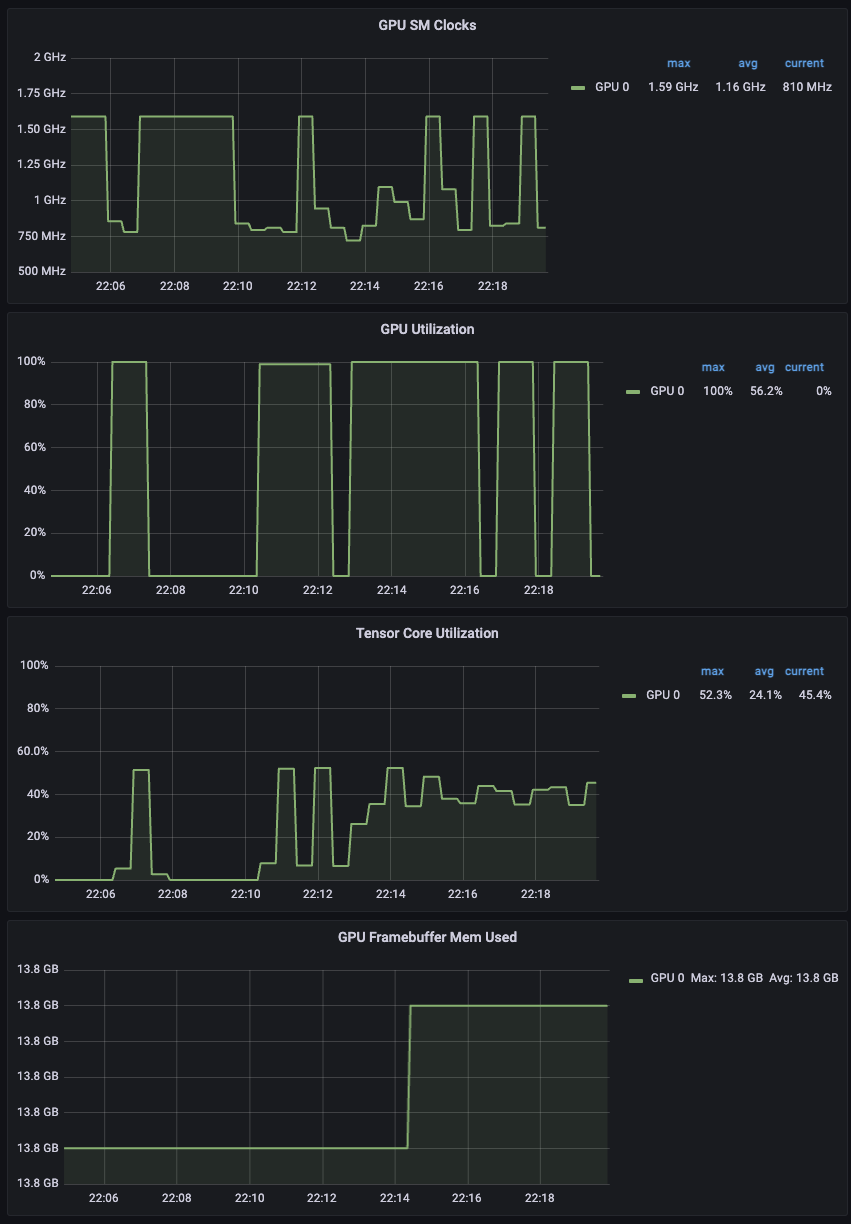
Monitoring the Deployment
Nvidia DCGM (Data Center GPU Manager)
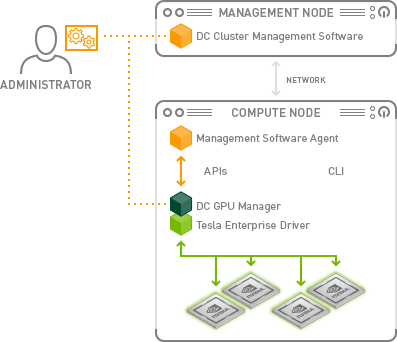
During the cluster creation process, the NVIDIA device plugin will get installed. You will need to remove it after cluster creation because we will use the NVIDIA GPU Operator instead.
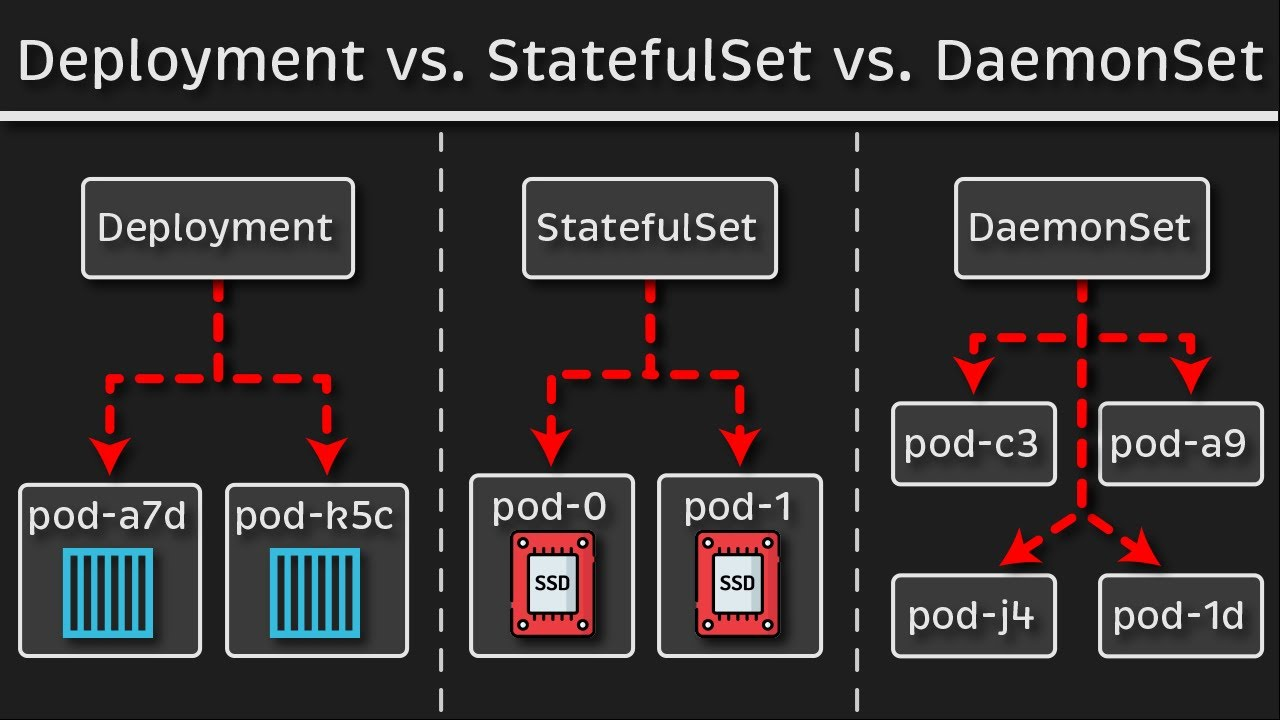
k get ds -n kube-systemkubectl -n kube-system delete daemonset nvidia-device-plugin-daemonsetWhat is a DaemonSet?
A DaemonSet is a controller that ensures that the pod runs on all the nodes of the cluster. If a node is added/removed from a cluster, DaemonSet automatically adds/deletes the pod.
kubectl create namespace gpu-operatorcurl https://raw.githubusercontent.com/NVIDIA/dcgm-exporter/main/etc/dcp-metrics-included.csv > dcgm-metrics.csvkubectl create configmap metrics-config -n gpu-operator --from-file=dcgm-metrics.csvhelm repo add nvidia https://helm.ngc.nvidia.com/nvidia && helm repo updatehelm install --wait \
--generate-name -n gpu-operator \
--create-namespace nvidia/gpu-operator \
--set "dcgmExporter.config.name"=metrics-config \
--set "dcgmExporter.env[0].name"=DCGM_EXPORTER_COLLECTORS \
--set "dcgmExporter.env[0].value"=/etc/dcgm-exporter/dcgm-metrics.csv \
--set toolkit.enabled=falsekubectl -n gpu-operator logs -f $(kubectl -n gpu-operator get pods | grep dcgm | cut -d ' ' -f 1 | head -n 1)❯ kubectl -n gpu-operator logs -f $(kubectl -n gpu-operator get pods | grep dcgm | cut -d ' ' -f 1 | head -n 1)
Defaulted container "nvidia-dcgm-exporter" out of: nvidia-dcgm-exporter, toolkit-validation (init)
time="2023-10-12T15:27:05Z" level=info msg="Starting dcgm-exporter"
time="2023-10-12T15:27:05Z" level=info msg="DCGM successfully initialized!"
time="2023-10-12T15:27:05Z" level=info msg="Collecting DCP Metrics"
time="2023-10-12T15:27:05Z" level=info msg="No configmap data specified, falling back to metric file /etc/dcgm-exporter/dcgm-metrics.csv"
time="2023-10-12T15:27:05Z" level=info msg="Initializing system entities of type: GPU"
time="2023-10-12T15:27:05Z" level=info msg="Initializing system entities of type: NvSwitch"
time="2023-10-12T15:27:05Z" level=info msg="Not collecting switch metrics: no switches to monitor"
time="2023-10-12T15:27:05Z" level=info msg="Initializing system entities of type: NvLink"
time="2023-10-12T15:27:05Z" level=info msg="Not collecting link metrics: no switches to monitor"
time="2023-10-12T15:27:05Z" level=info msg="Kubernetes metrics collection enabled!"
time="2023-10-12T15:27:05Z" level=info msg="Pipeline starting"
time="2023-10-12T15:27:05Z" level=info msg="Starting webserver"Modify Prometheus to collect logs from DGCA
curl https://raw.githubusercontent.com/istio/istio/release-1.18/samples/addons/prometheus.yamlAdd the following
    - honor_labels: true
      job_name: 'kubernetes-pod-dcgm-exporter'
      sample_limit: 10000
      metrics_path: /api/v1/metrics/prometheus
      kubernetes_sd_configs:
      - role: pod
      relabel_configs:
      - source_labels: [__meta_kubernetes_pod_container_name]
        action: keep
        regex: '^DCGM.*$'
      - source_labels: [__address__]
        action: replace
        regex: ([^:]+)(?::\d+)?
        replacement: ${1}:9400
        target_label: __address__
      - action: labelmap
        regex: __meta_kubernetes_pod_label_(.+)
      - action: replace
        source_labels:
        - __meta_kubernetes_namespace
        target_label: Namespace
      - source_labels: [__meta_kubernetes_pod]
        action: replace
        target_label: pod
      - action: replace
        source_labels:
        - __meta_kubernetes_pod_container_name
        target_label: container_name
      - action: replace
        source_labels:
        - __meta_kubernetes_pod_controller_name
        target_label: pod_controller_name
      - action: replace
        source_labels:
        - __meta_kubernetes_pod_controller_kind
        target_label: pod_controller_kind
      - action: replace
        source_labels:
        - __meta_kubernetes_pod_phase
        target_label: pod_phase
      - action: replace
        source_labels:
        - __meta_kubernetes_pod_node_name
        target_label: NodeName
k apply -f prometheus.yamlkubectl port-forward svc/prometheus 9090:9090 -n istio-systemOpen http://localhost:9090
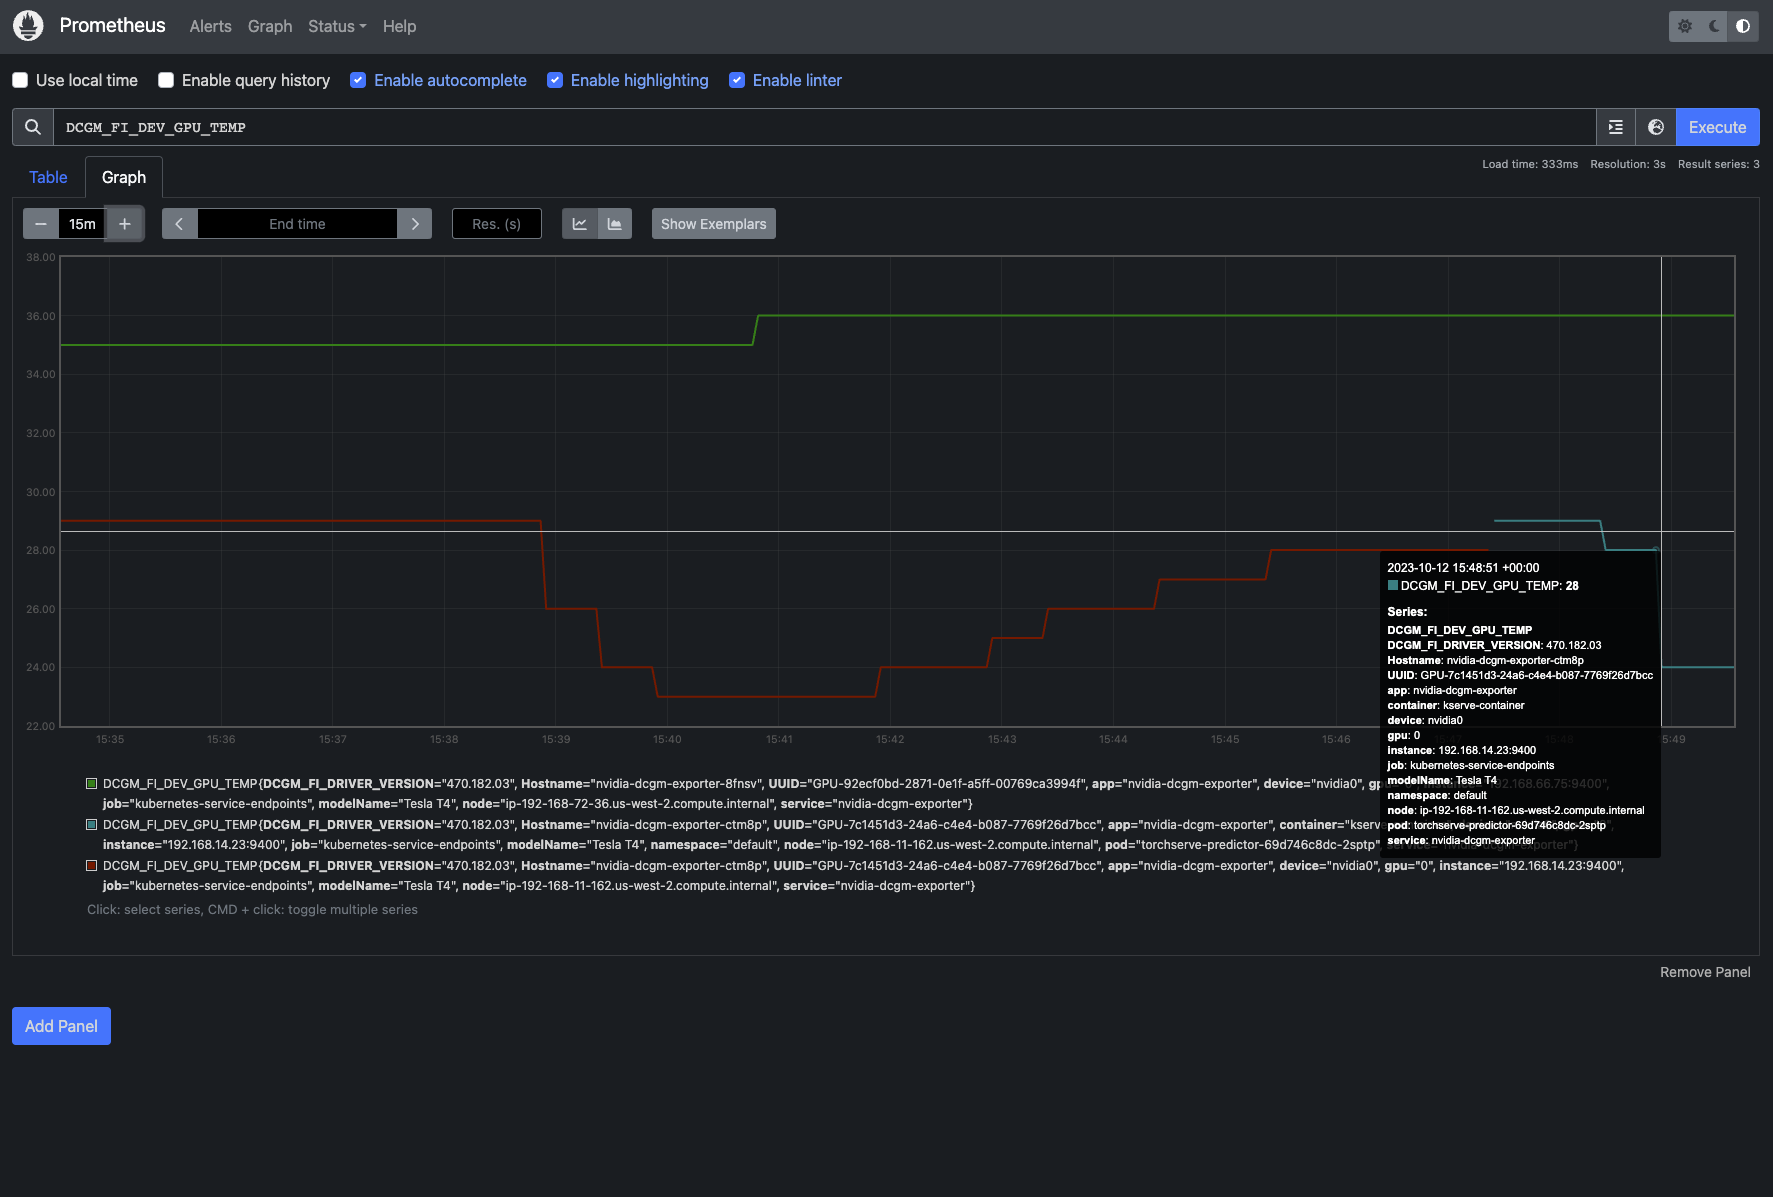
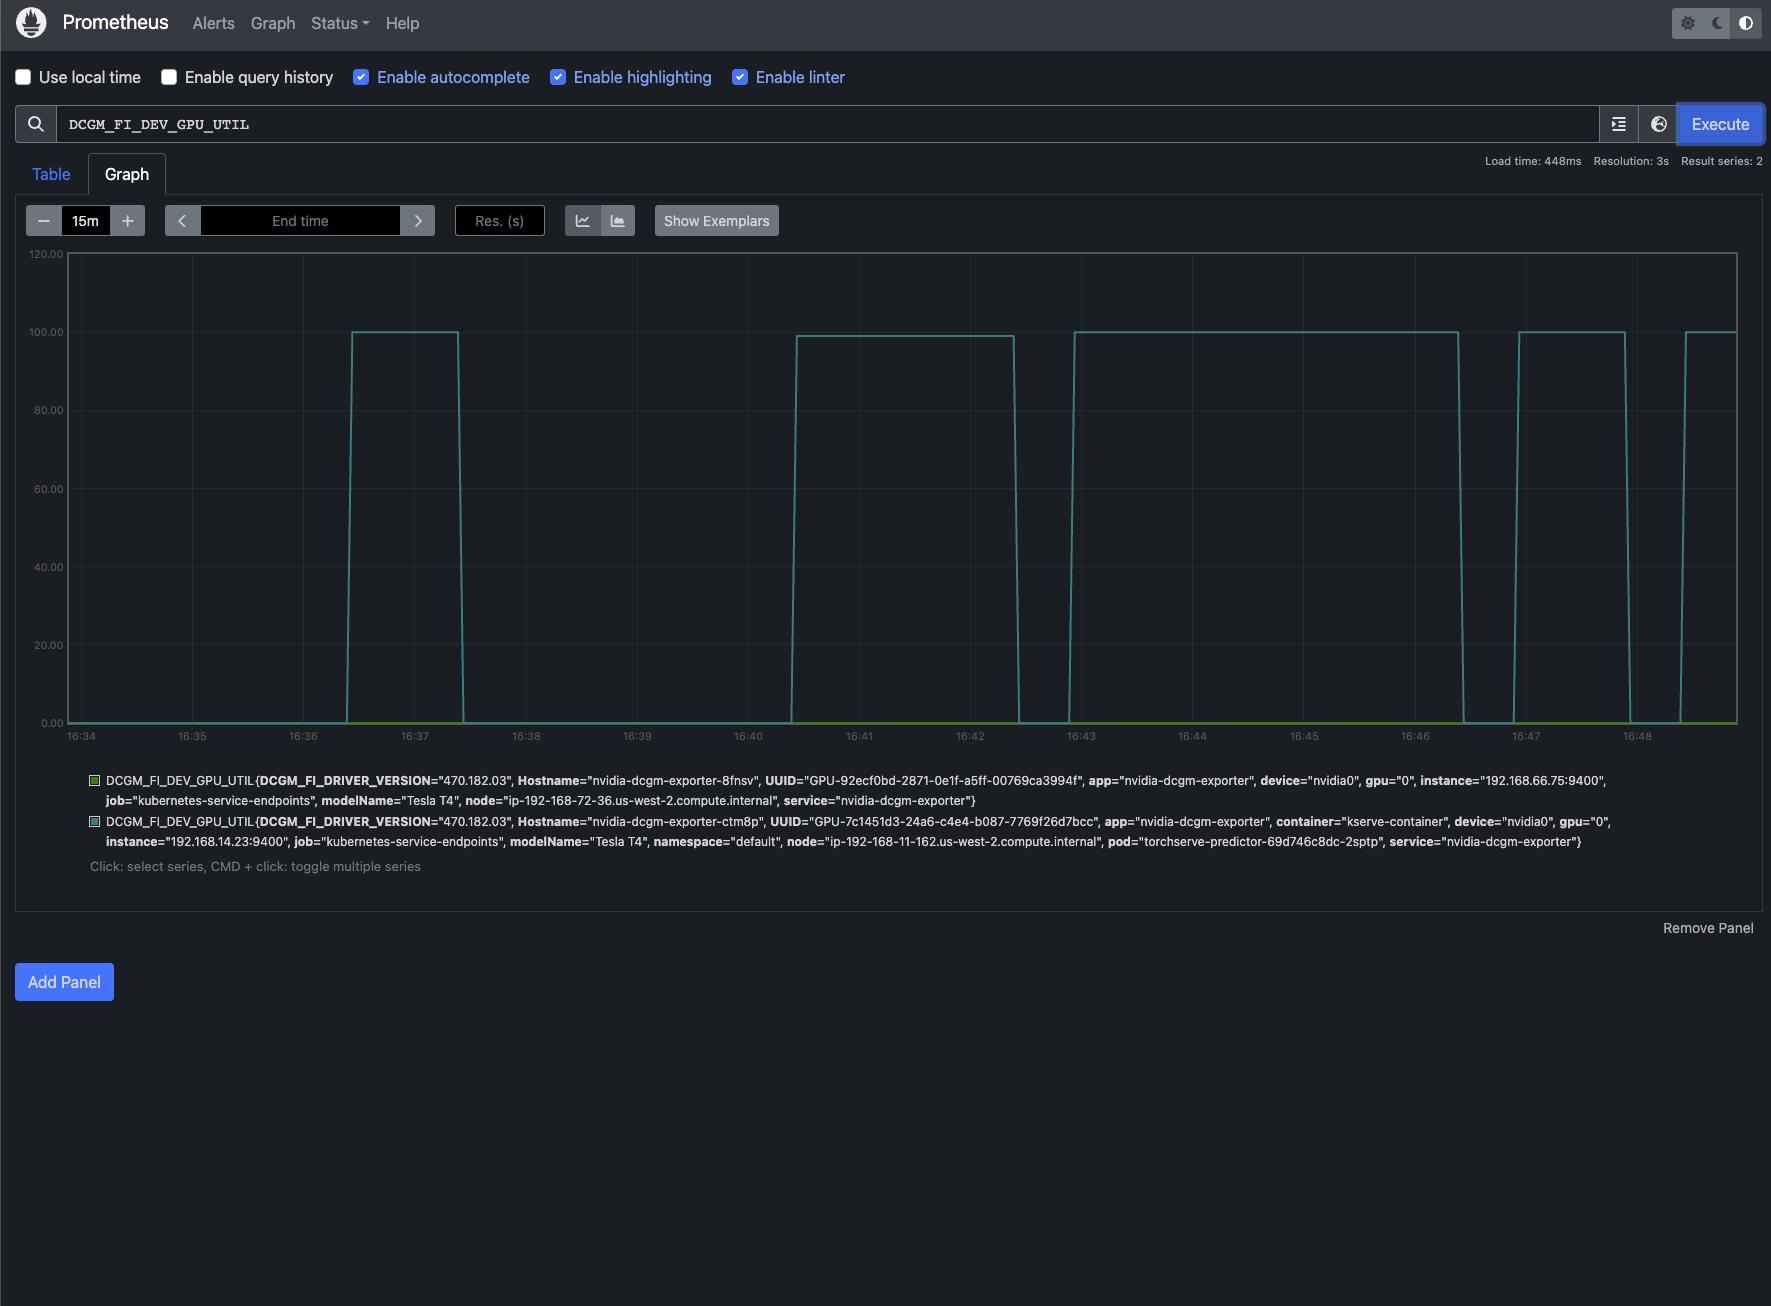
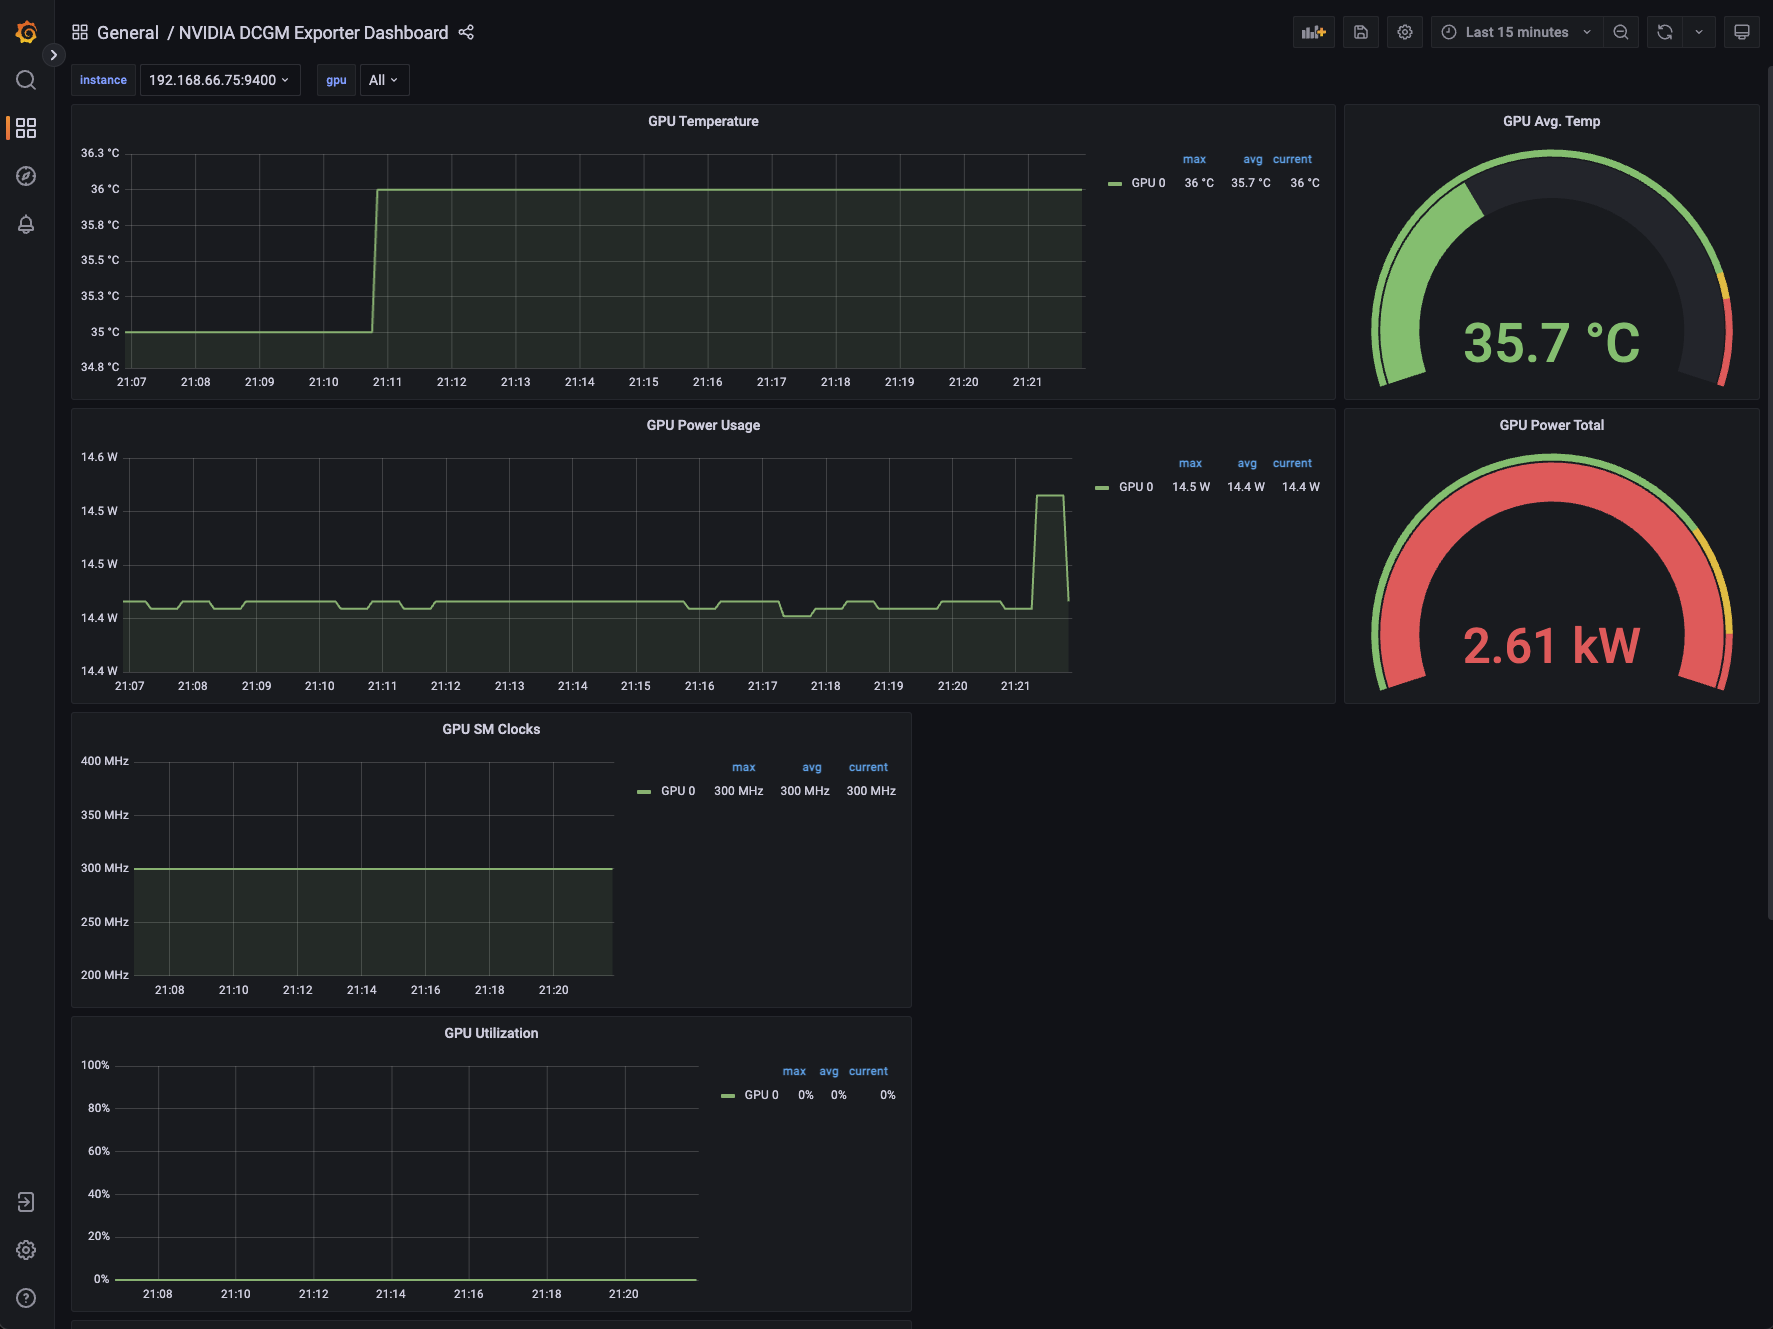
The metrics can be viewed on Grafana as well!
kubectl port-forward svc/grafana 3000:3000 -n istio-systemDownload DCGM Grafana Dashboard JSON from https://grafana.com/grafana/dashboards/12239-nvidia-dcgm-exporter-dashboard/ and import it in Grafana
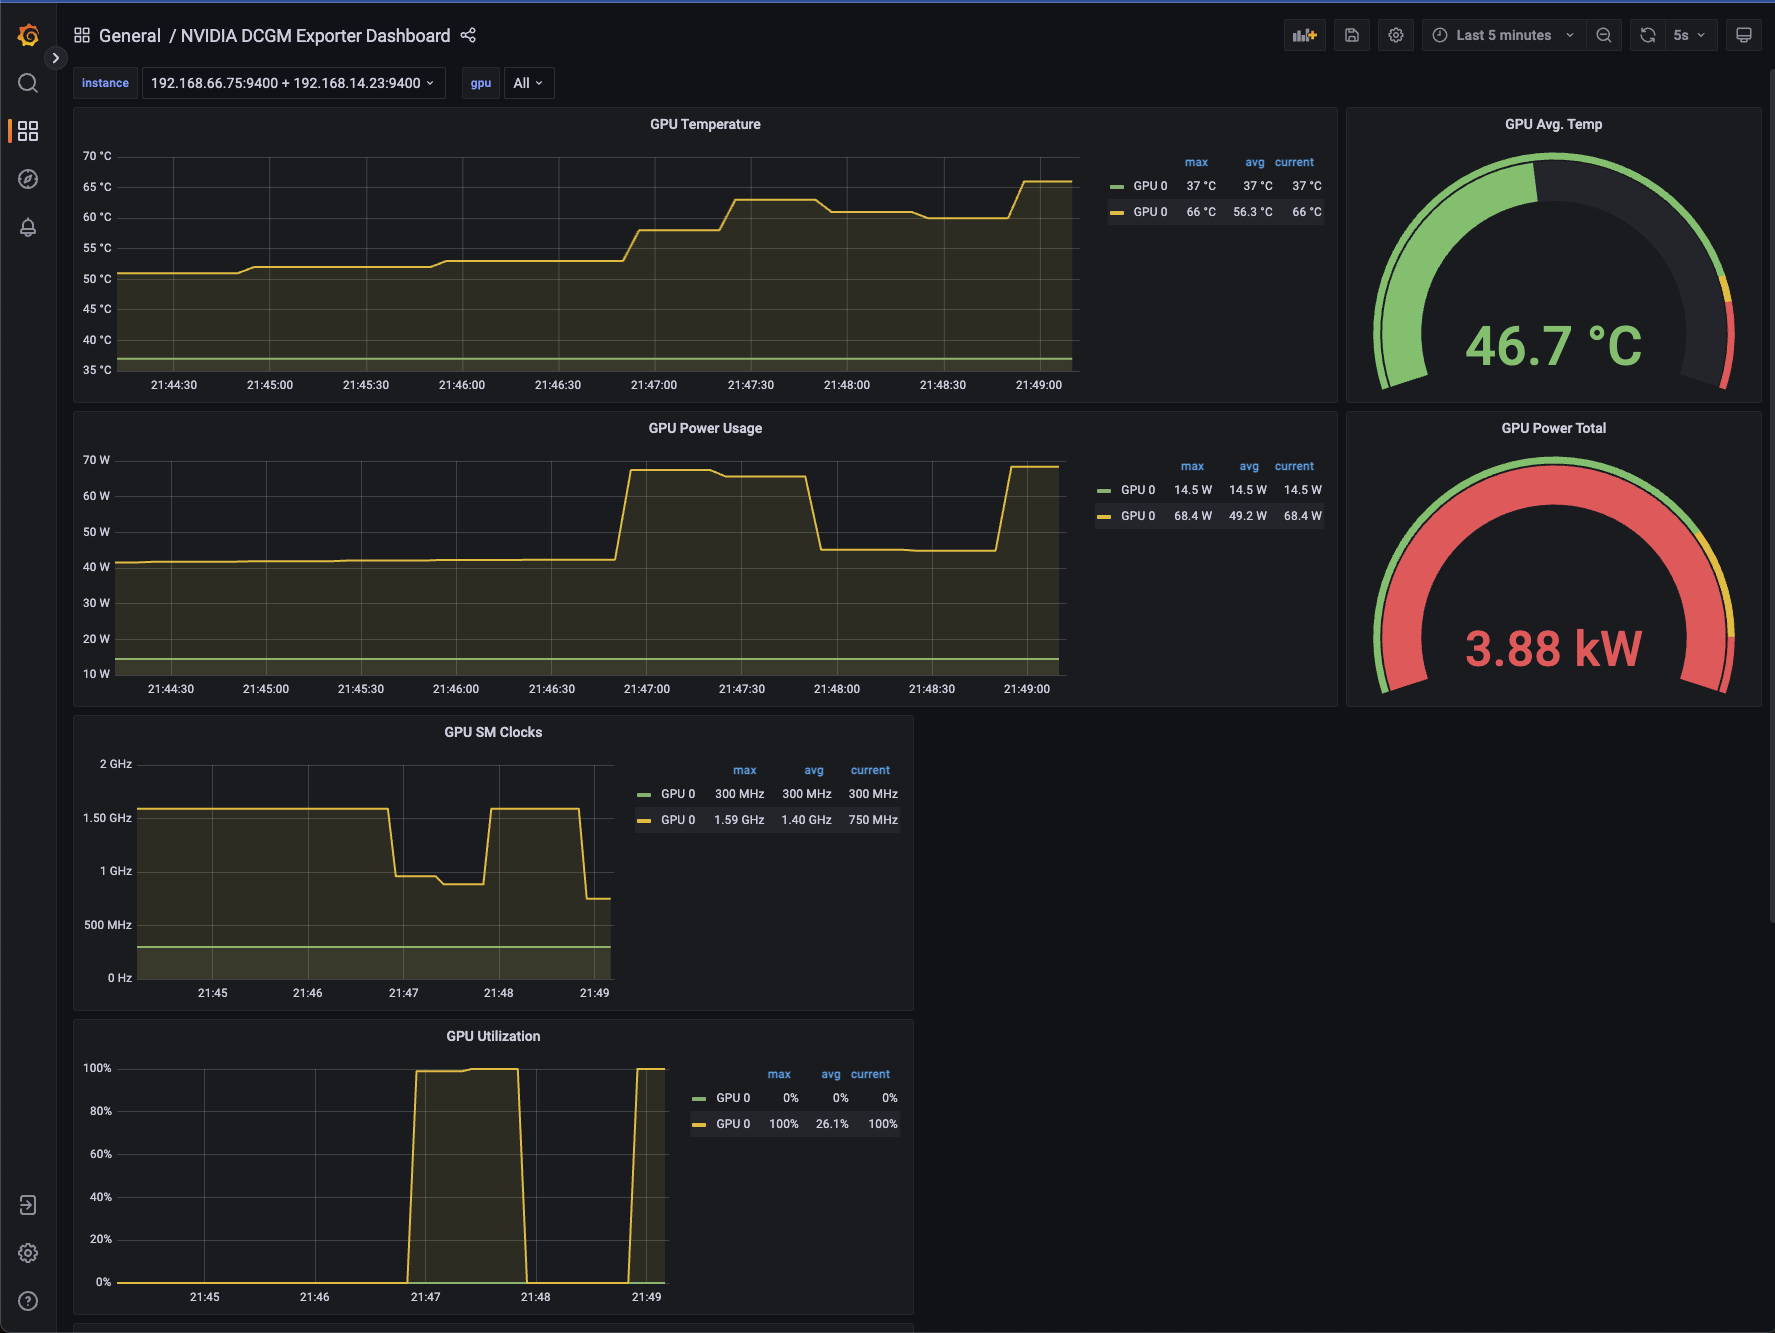
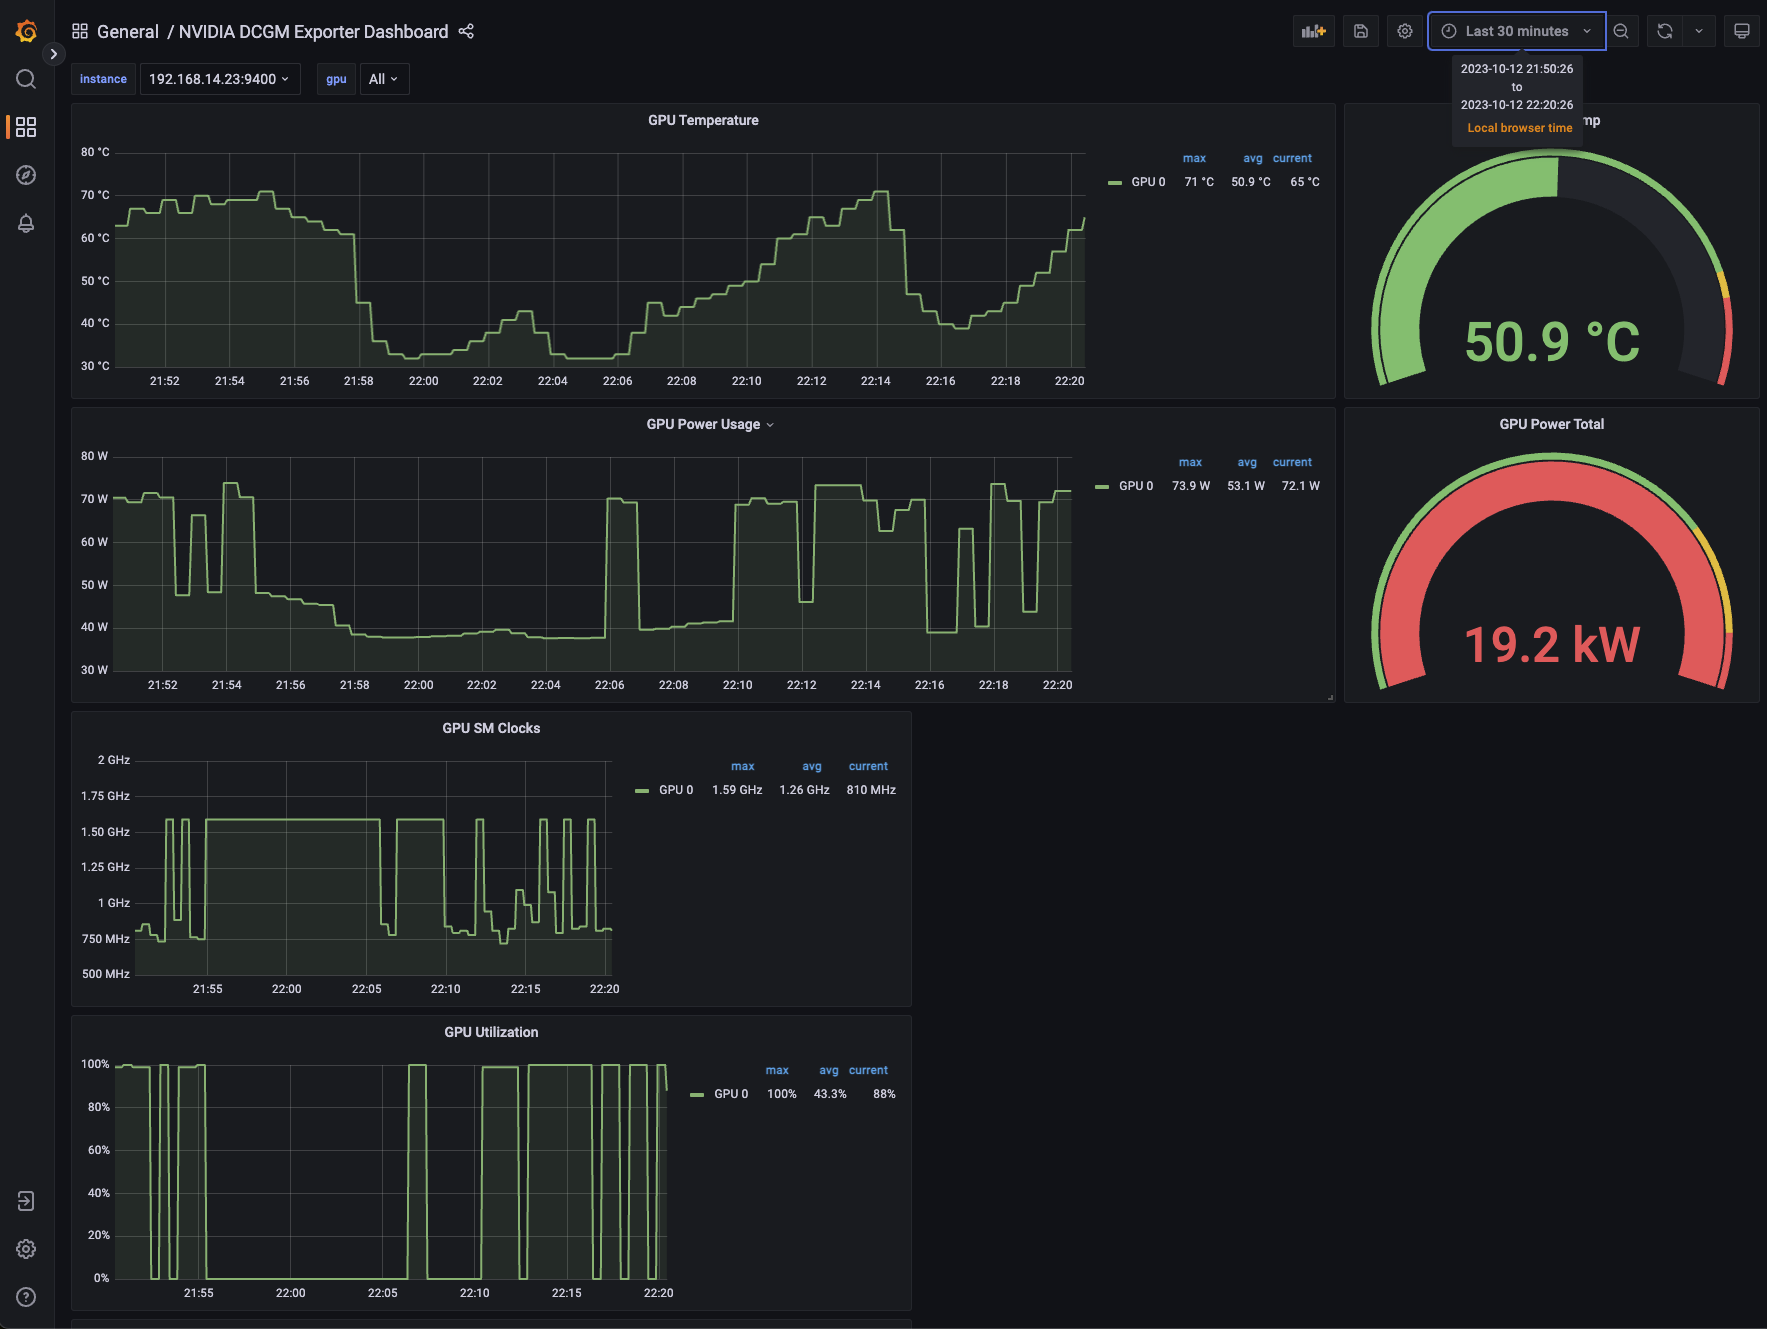
Under Load
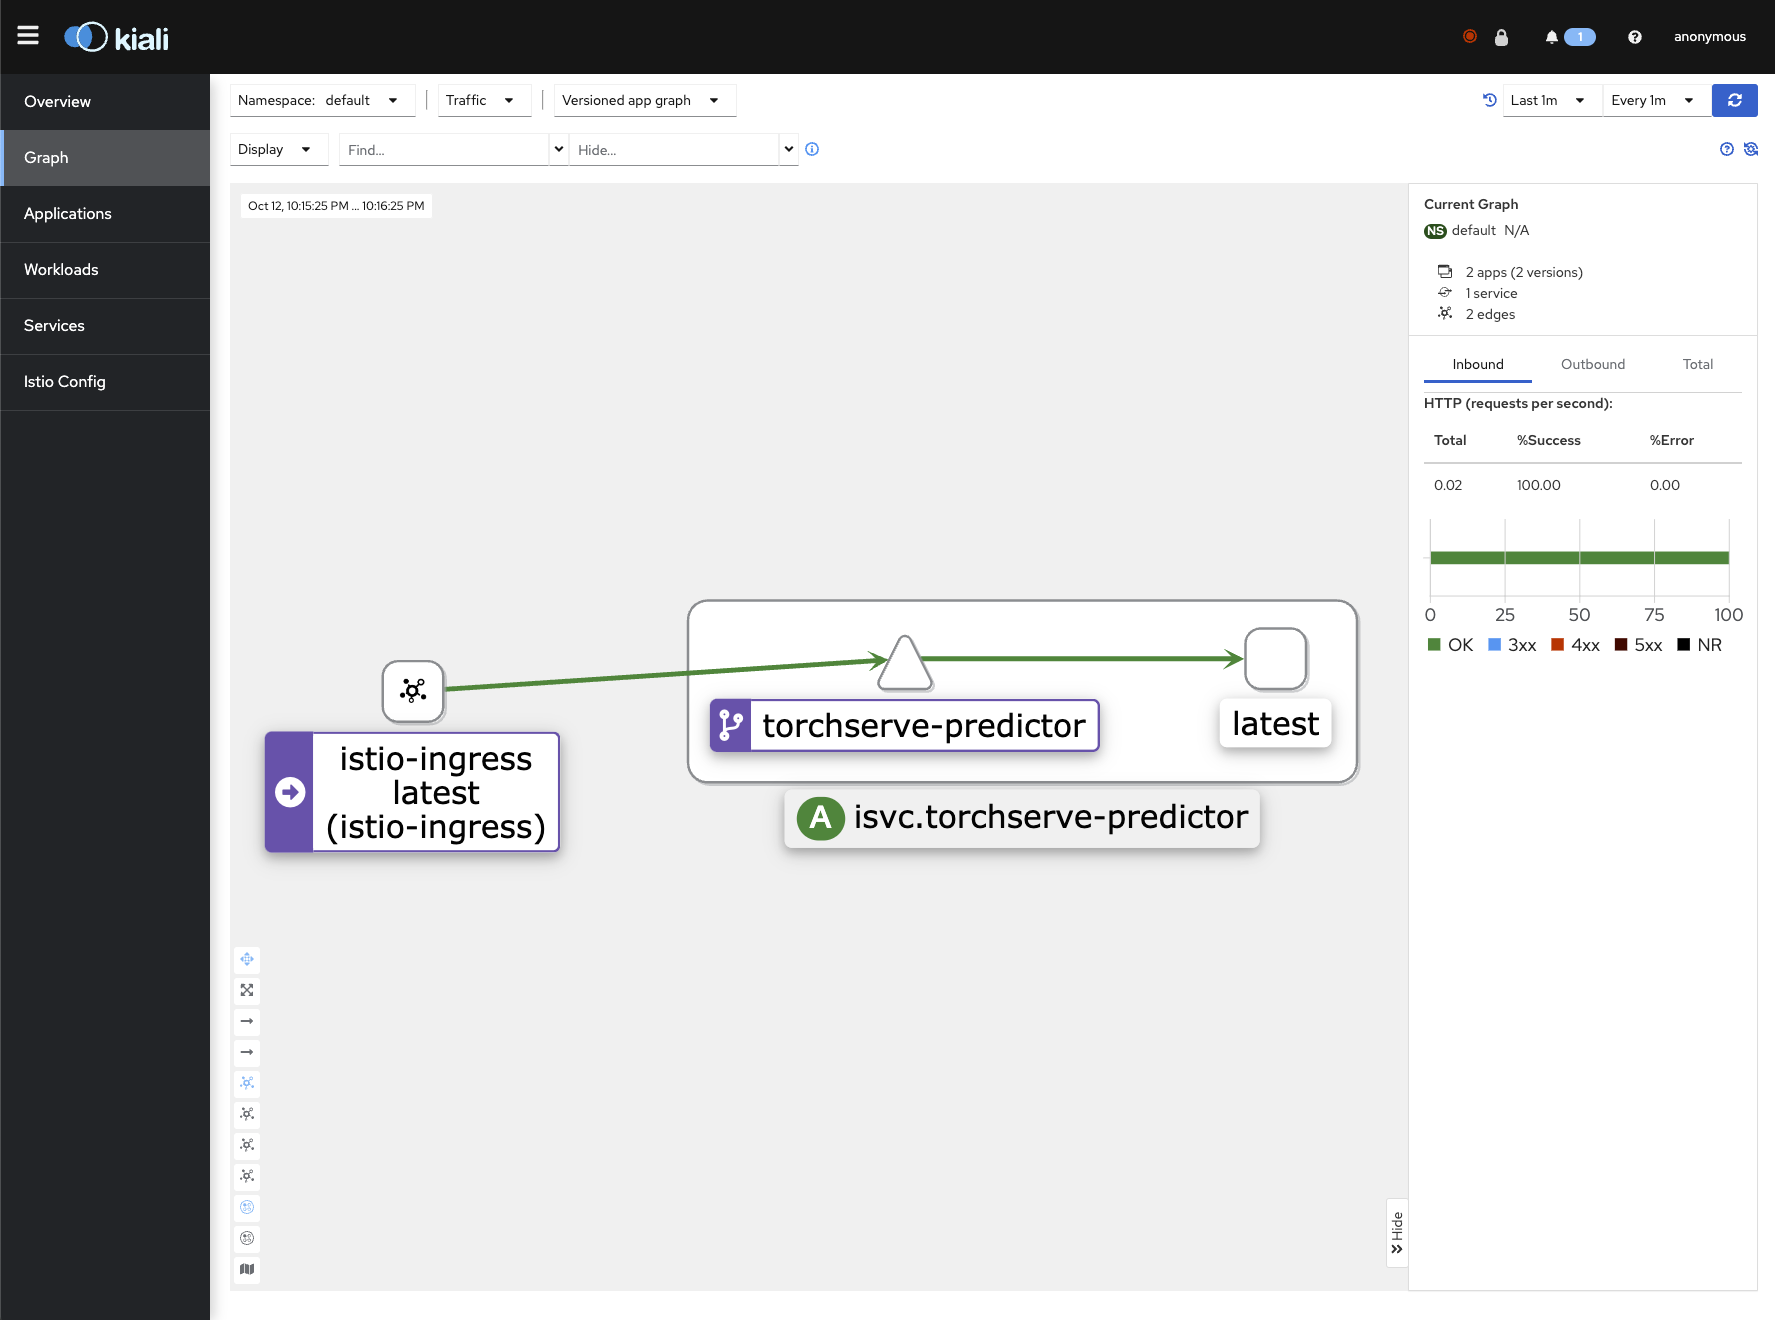
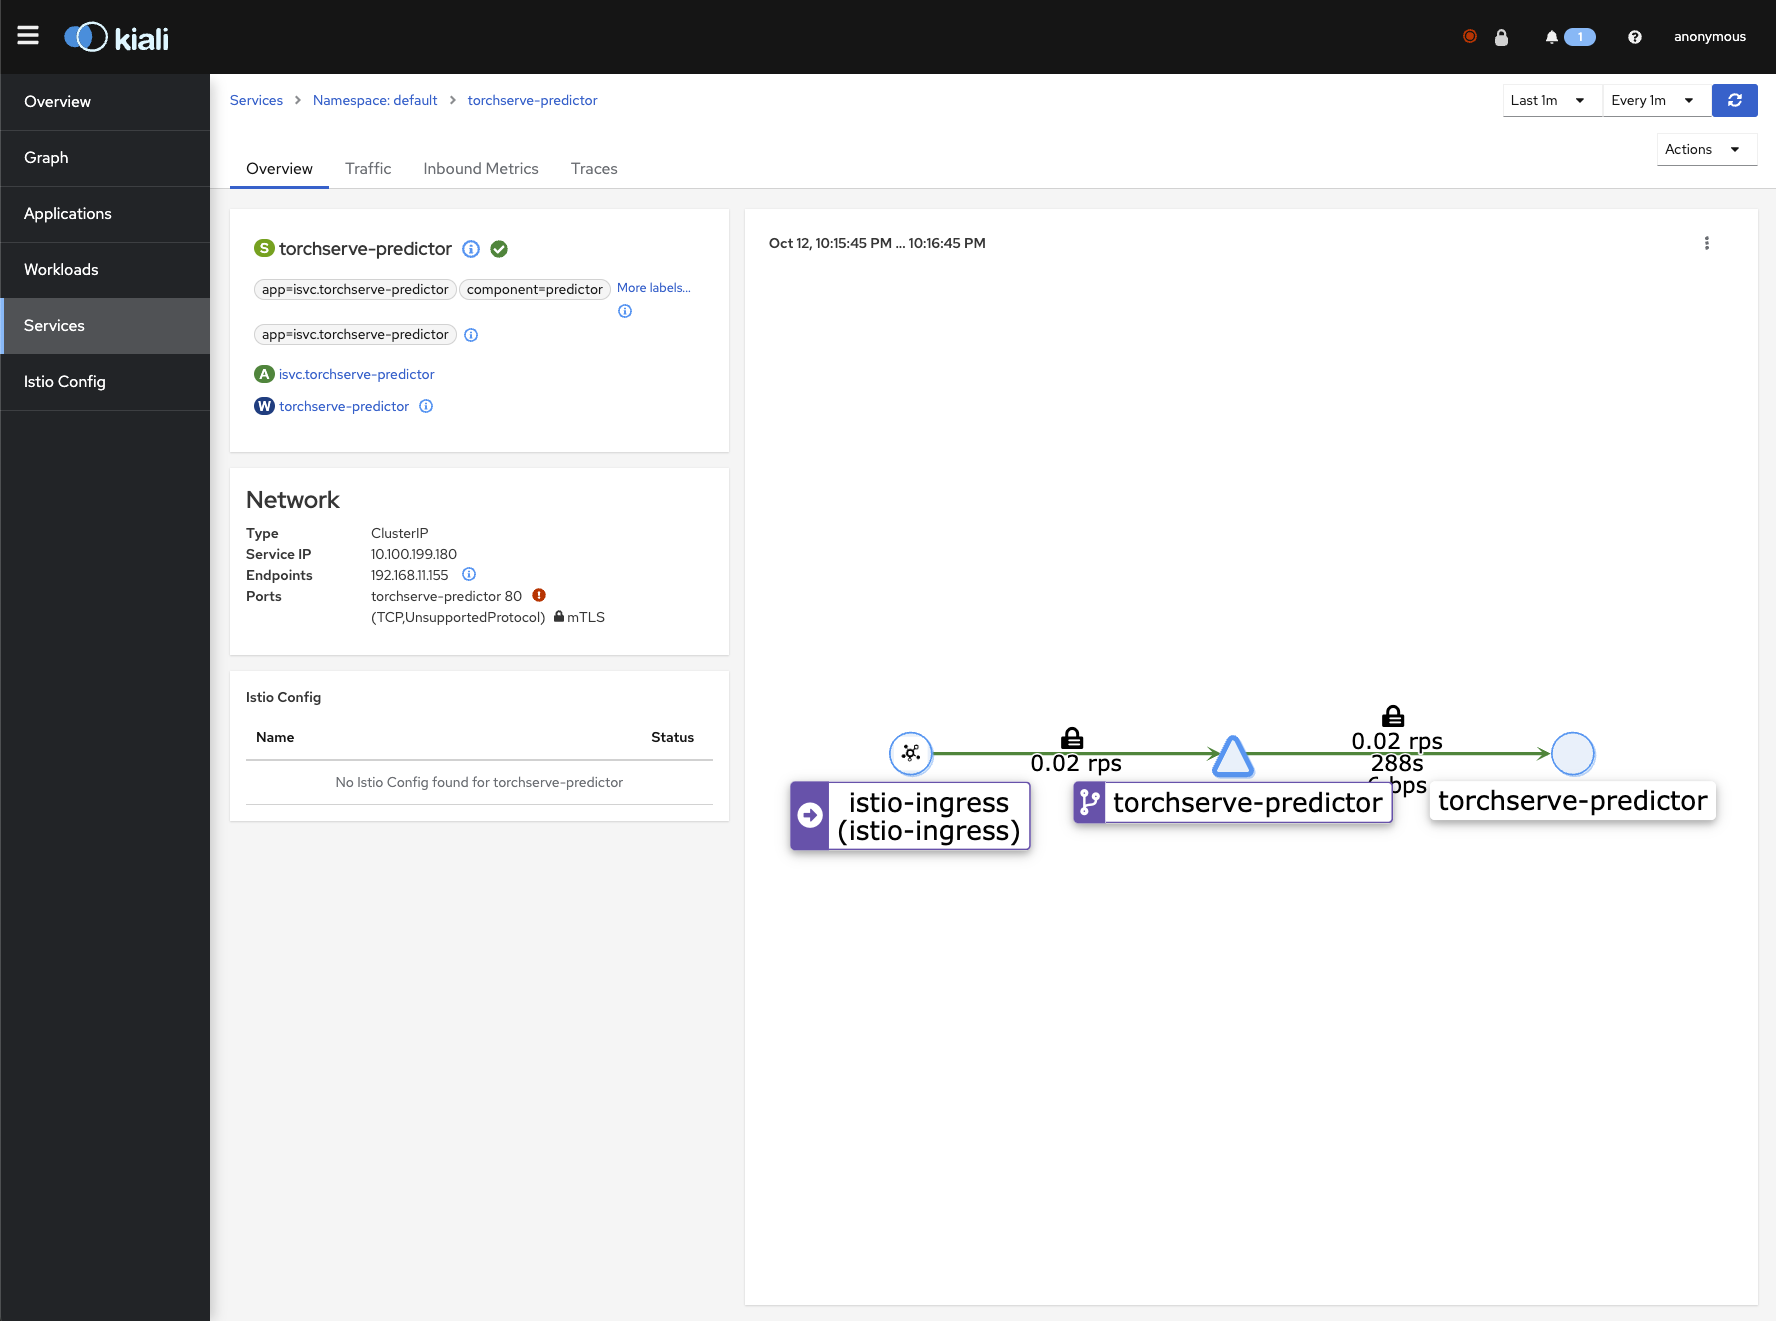
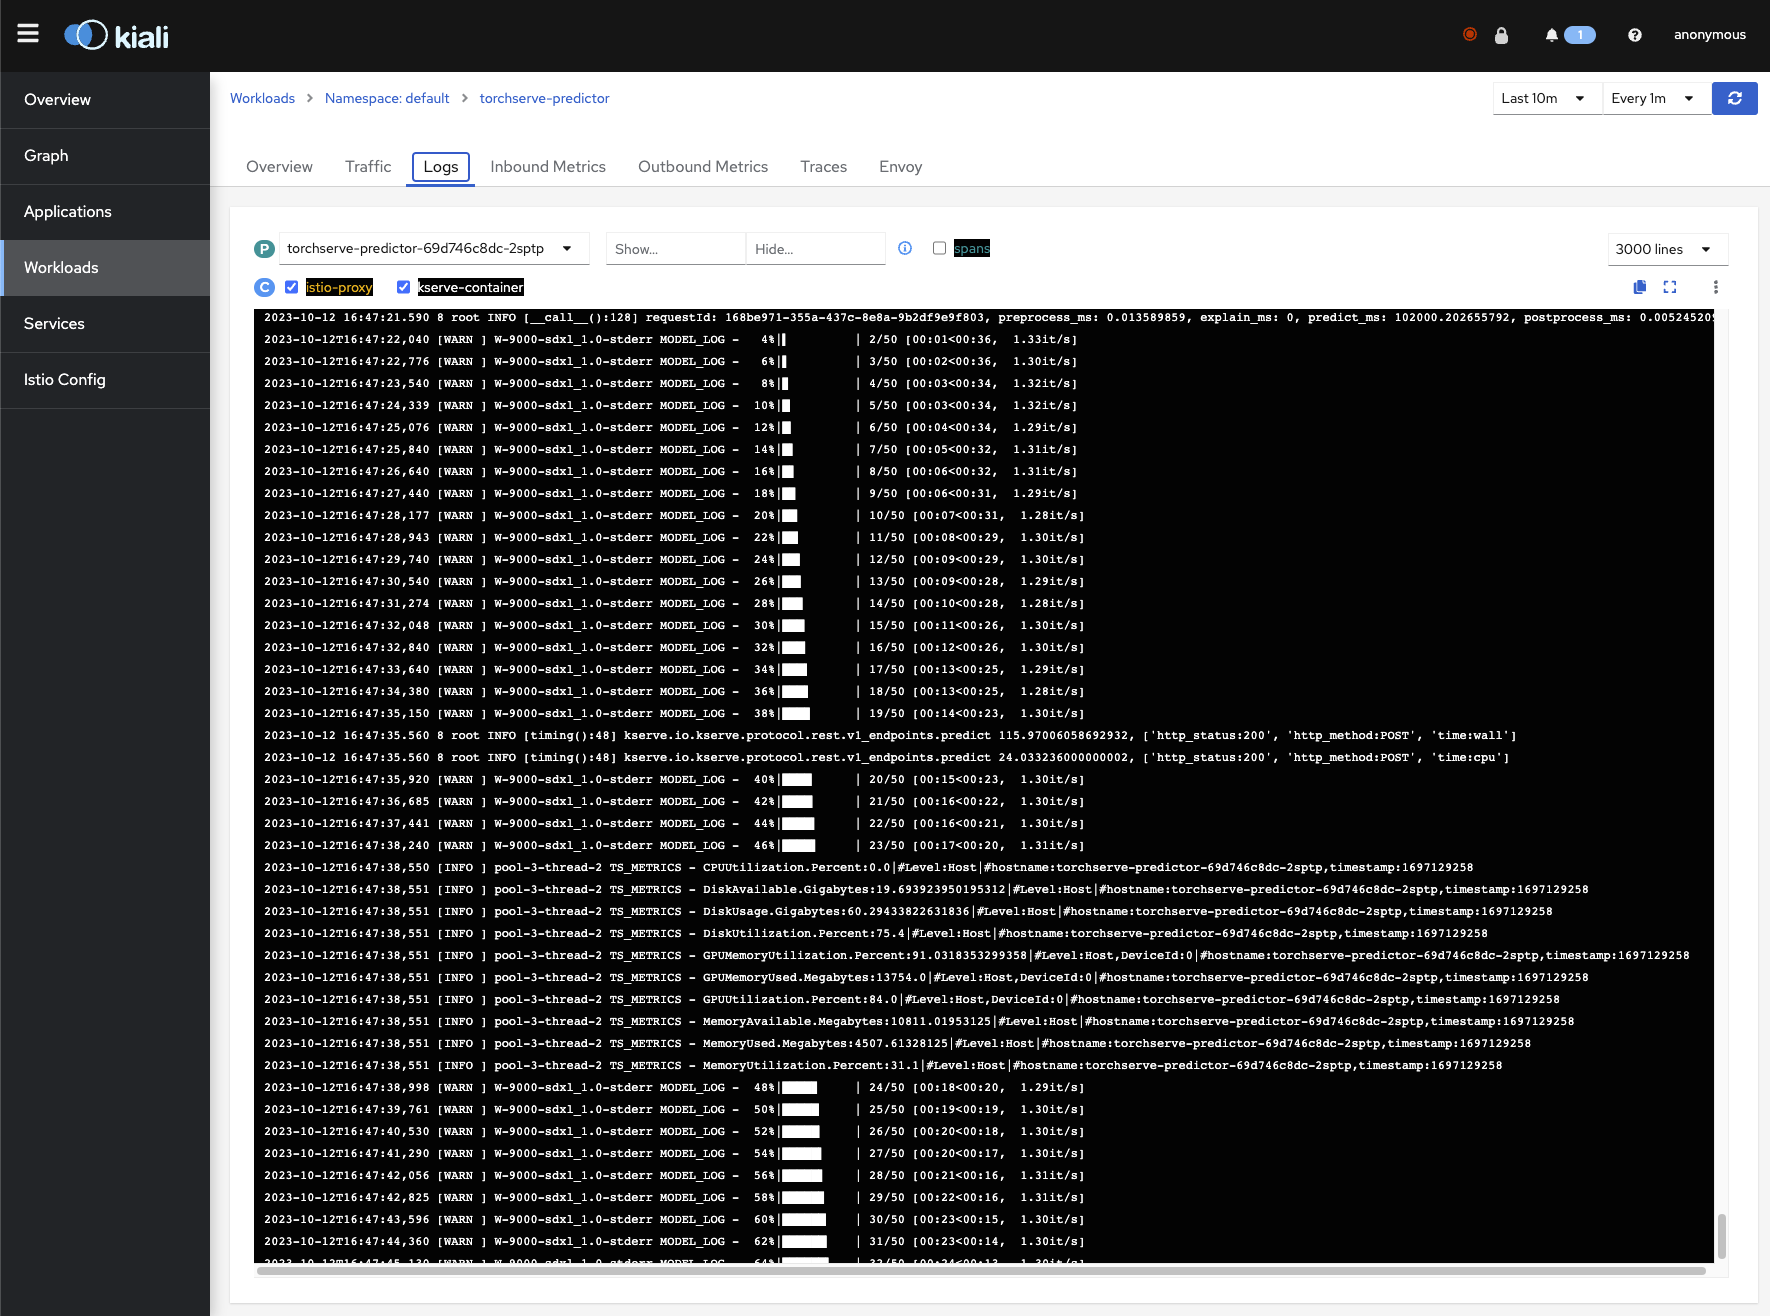
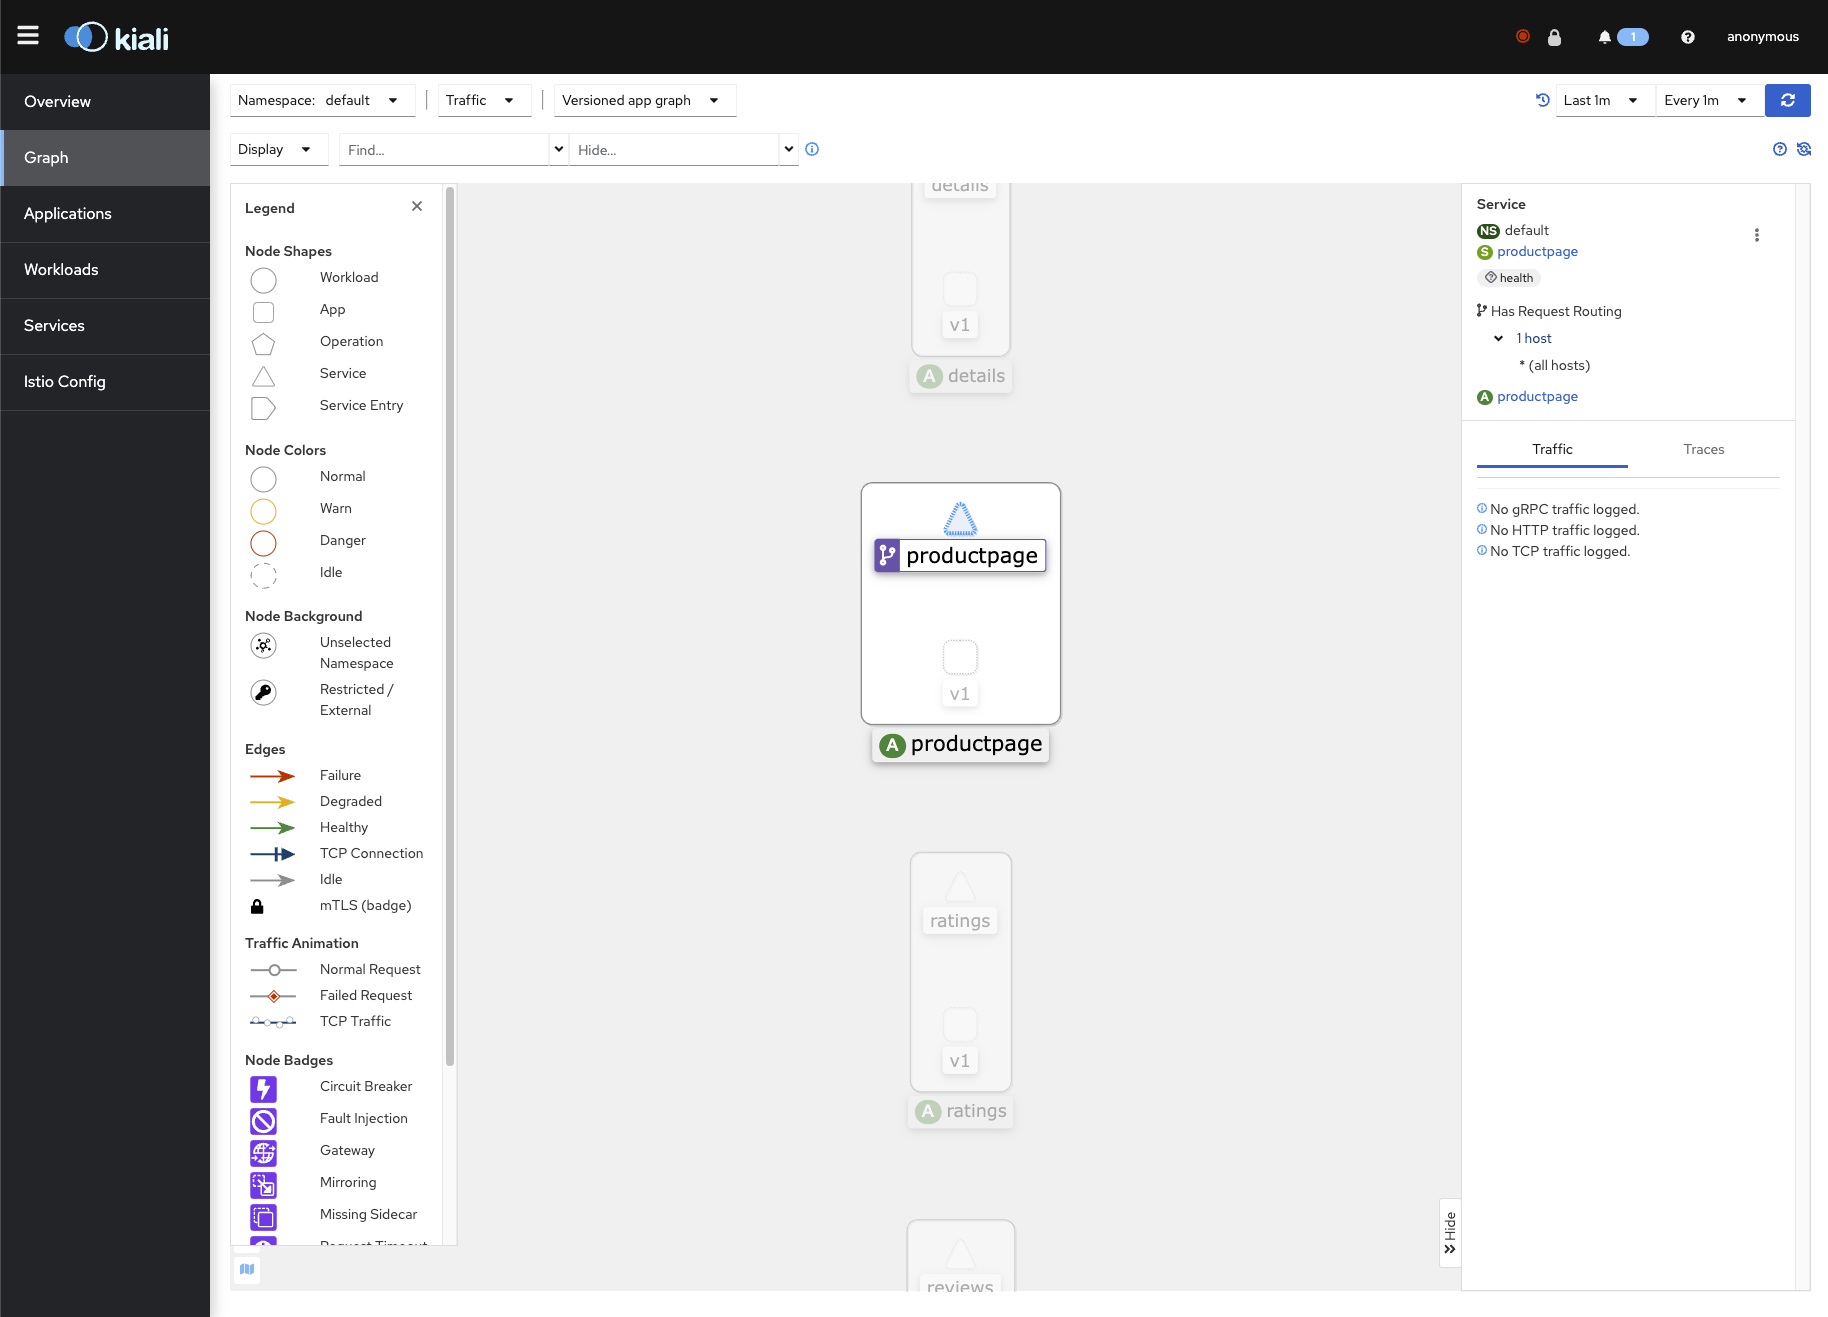
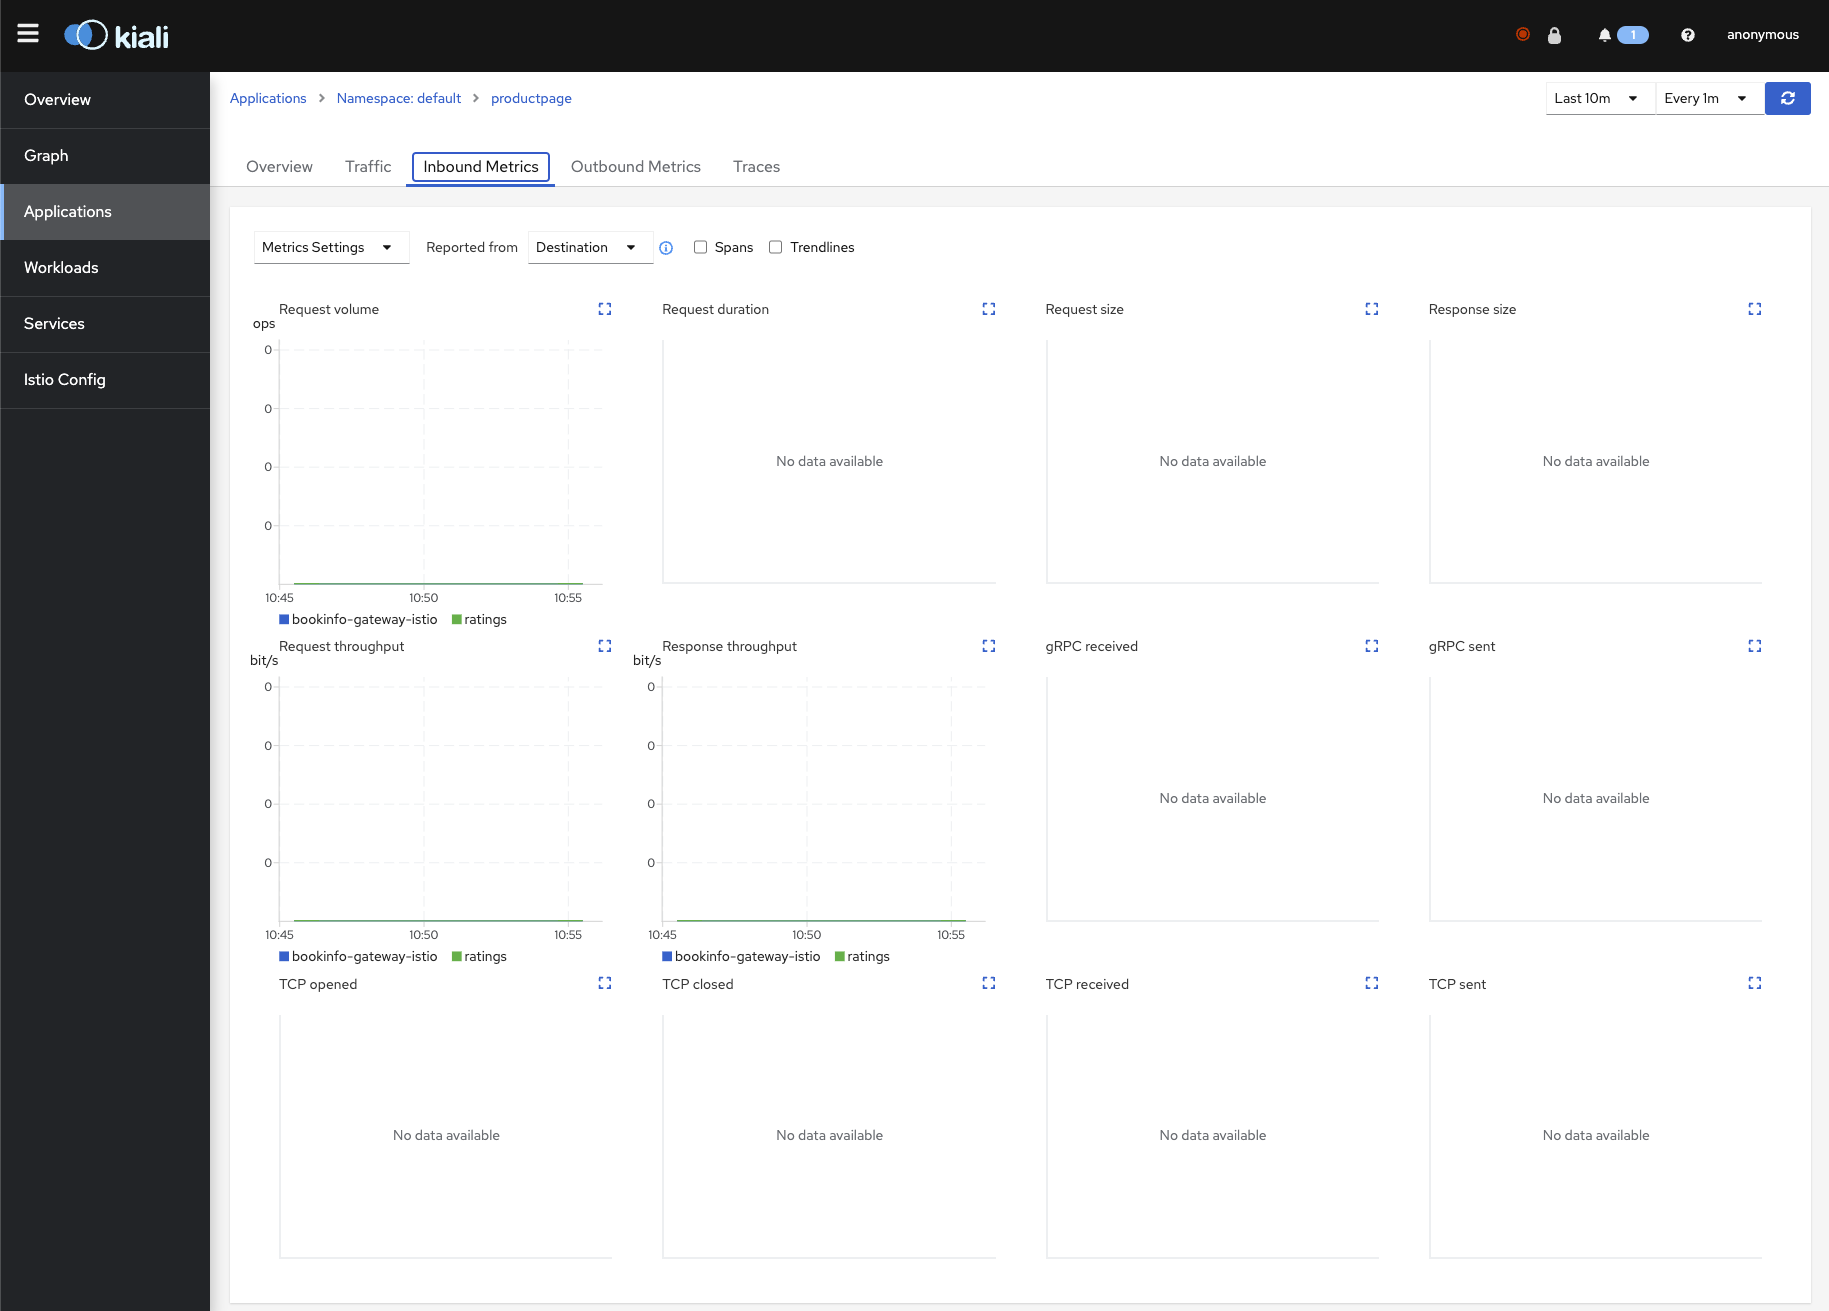
Kiali
kubectl port-forward svc/kiali 20001:20001 -n istio-system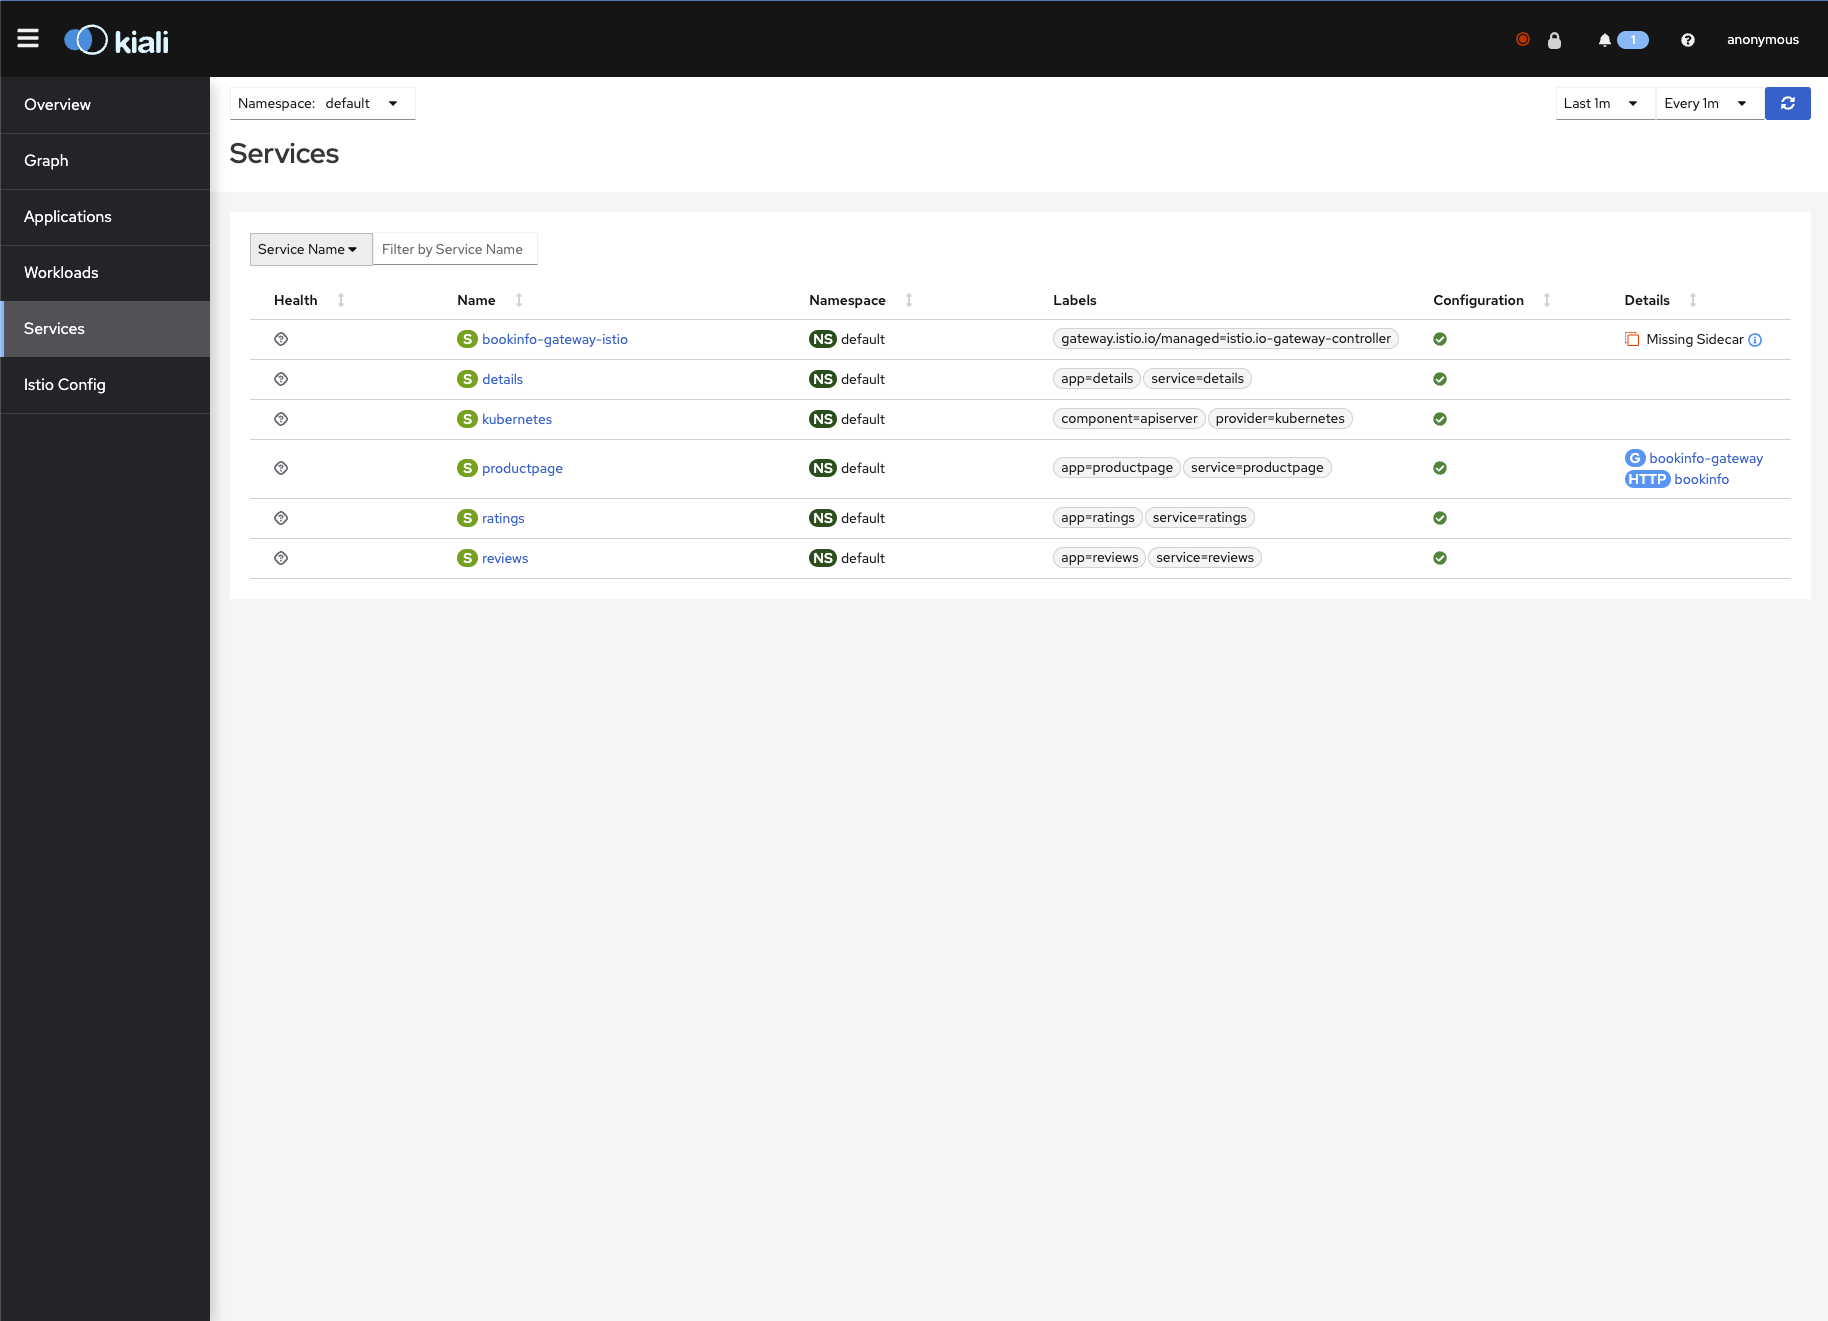
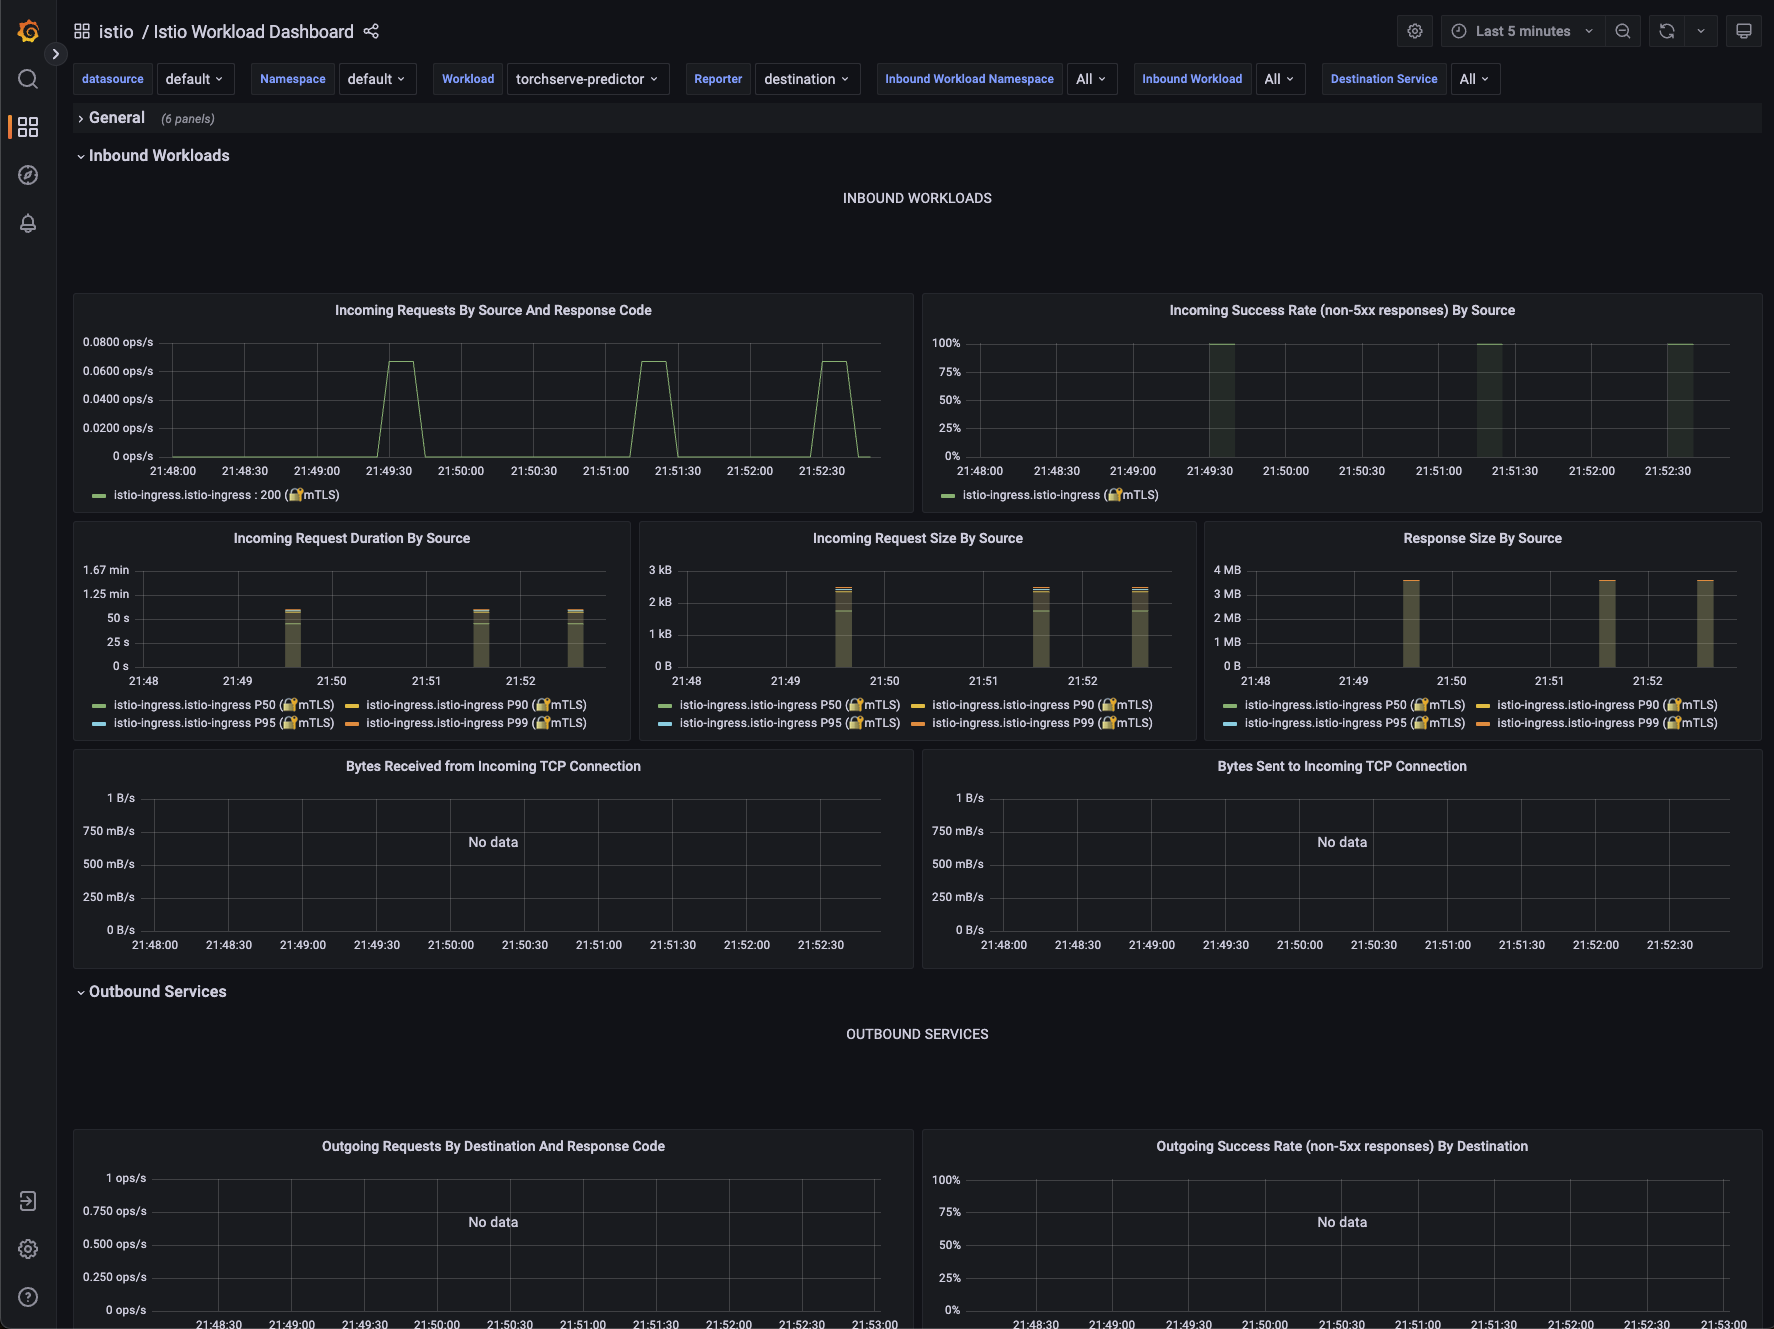
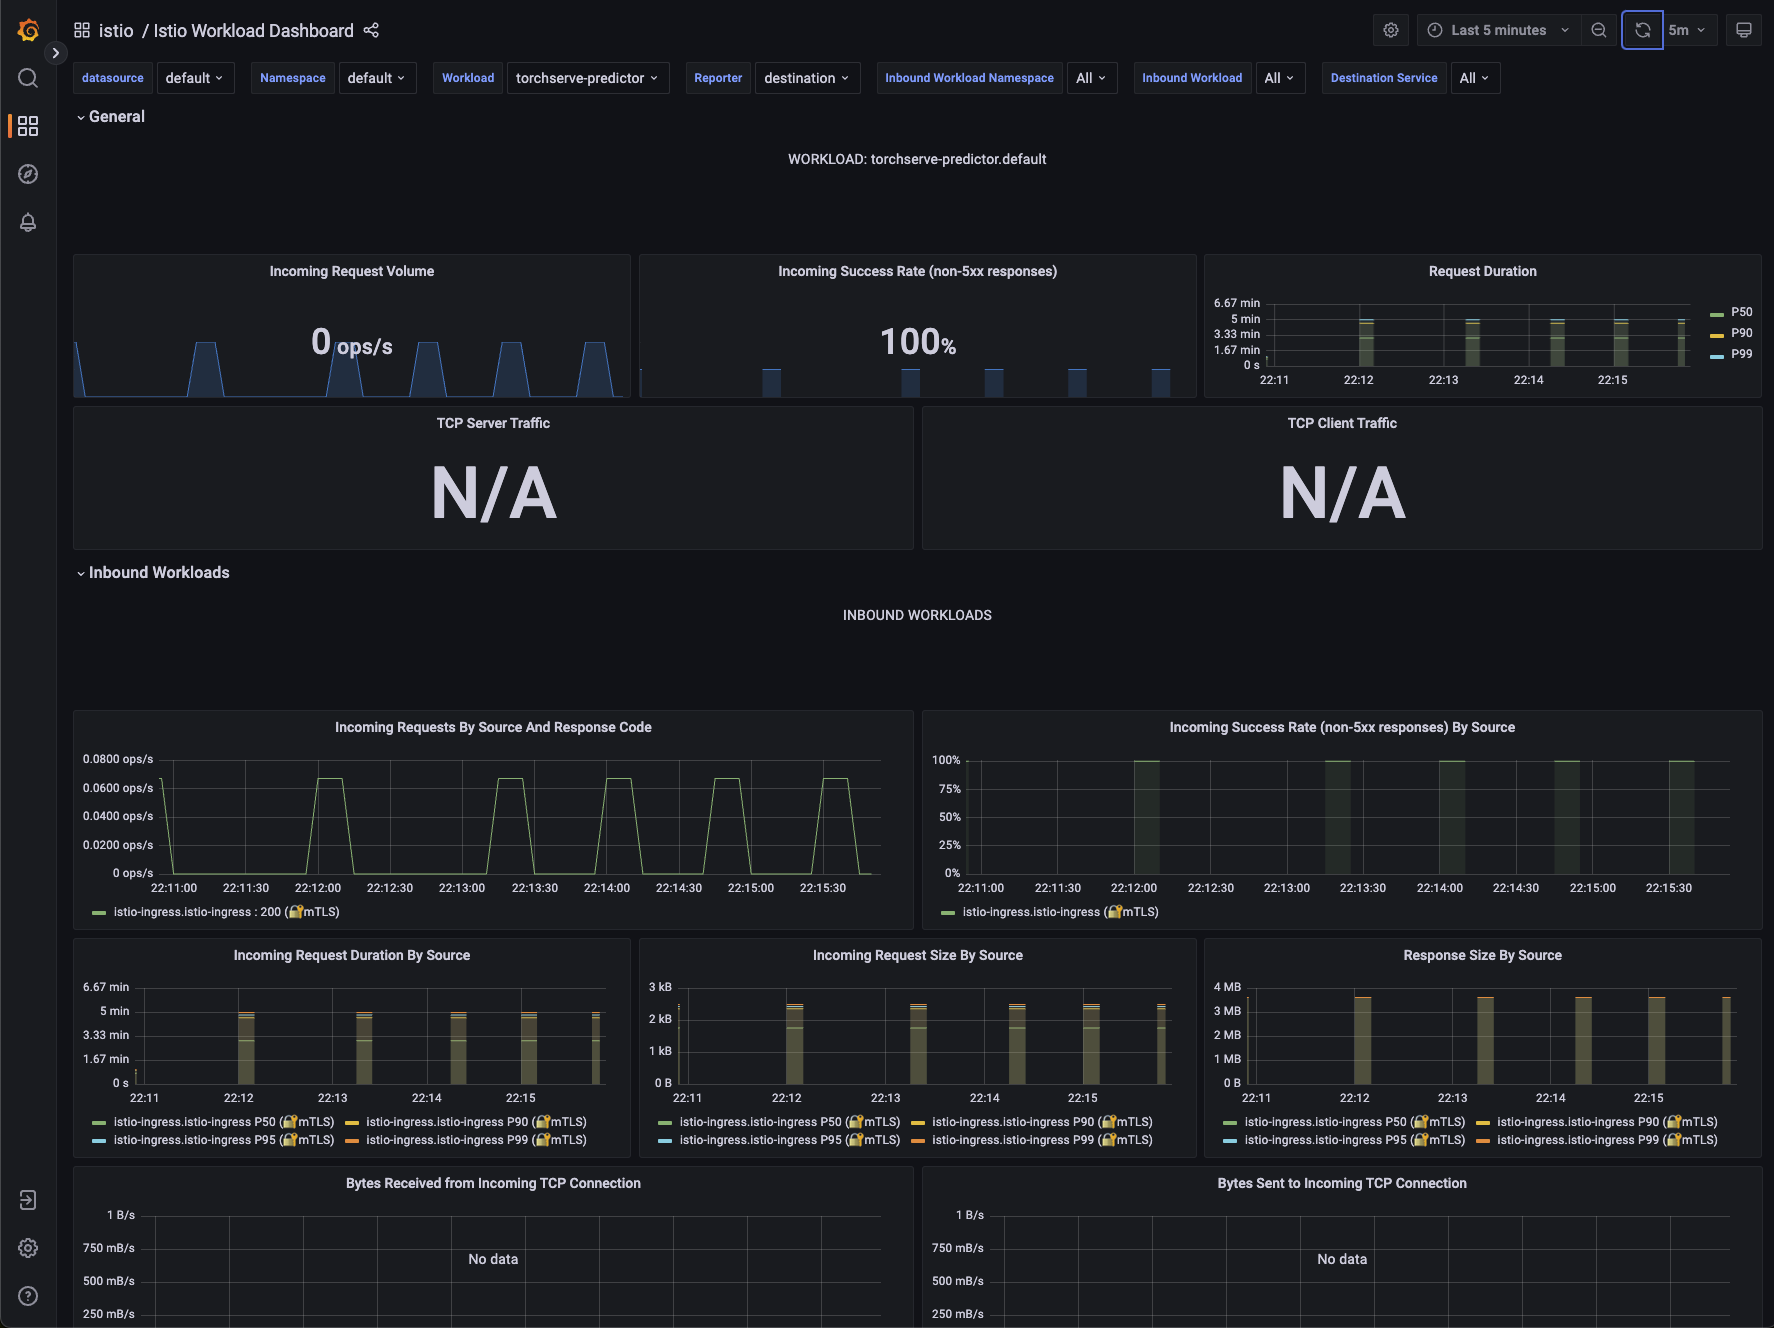
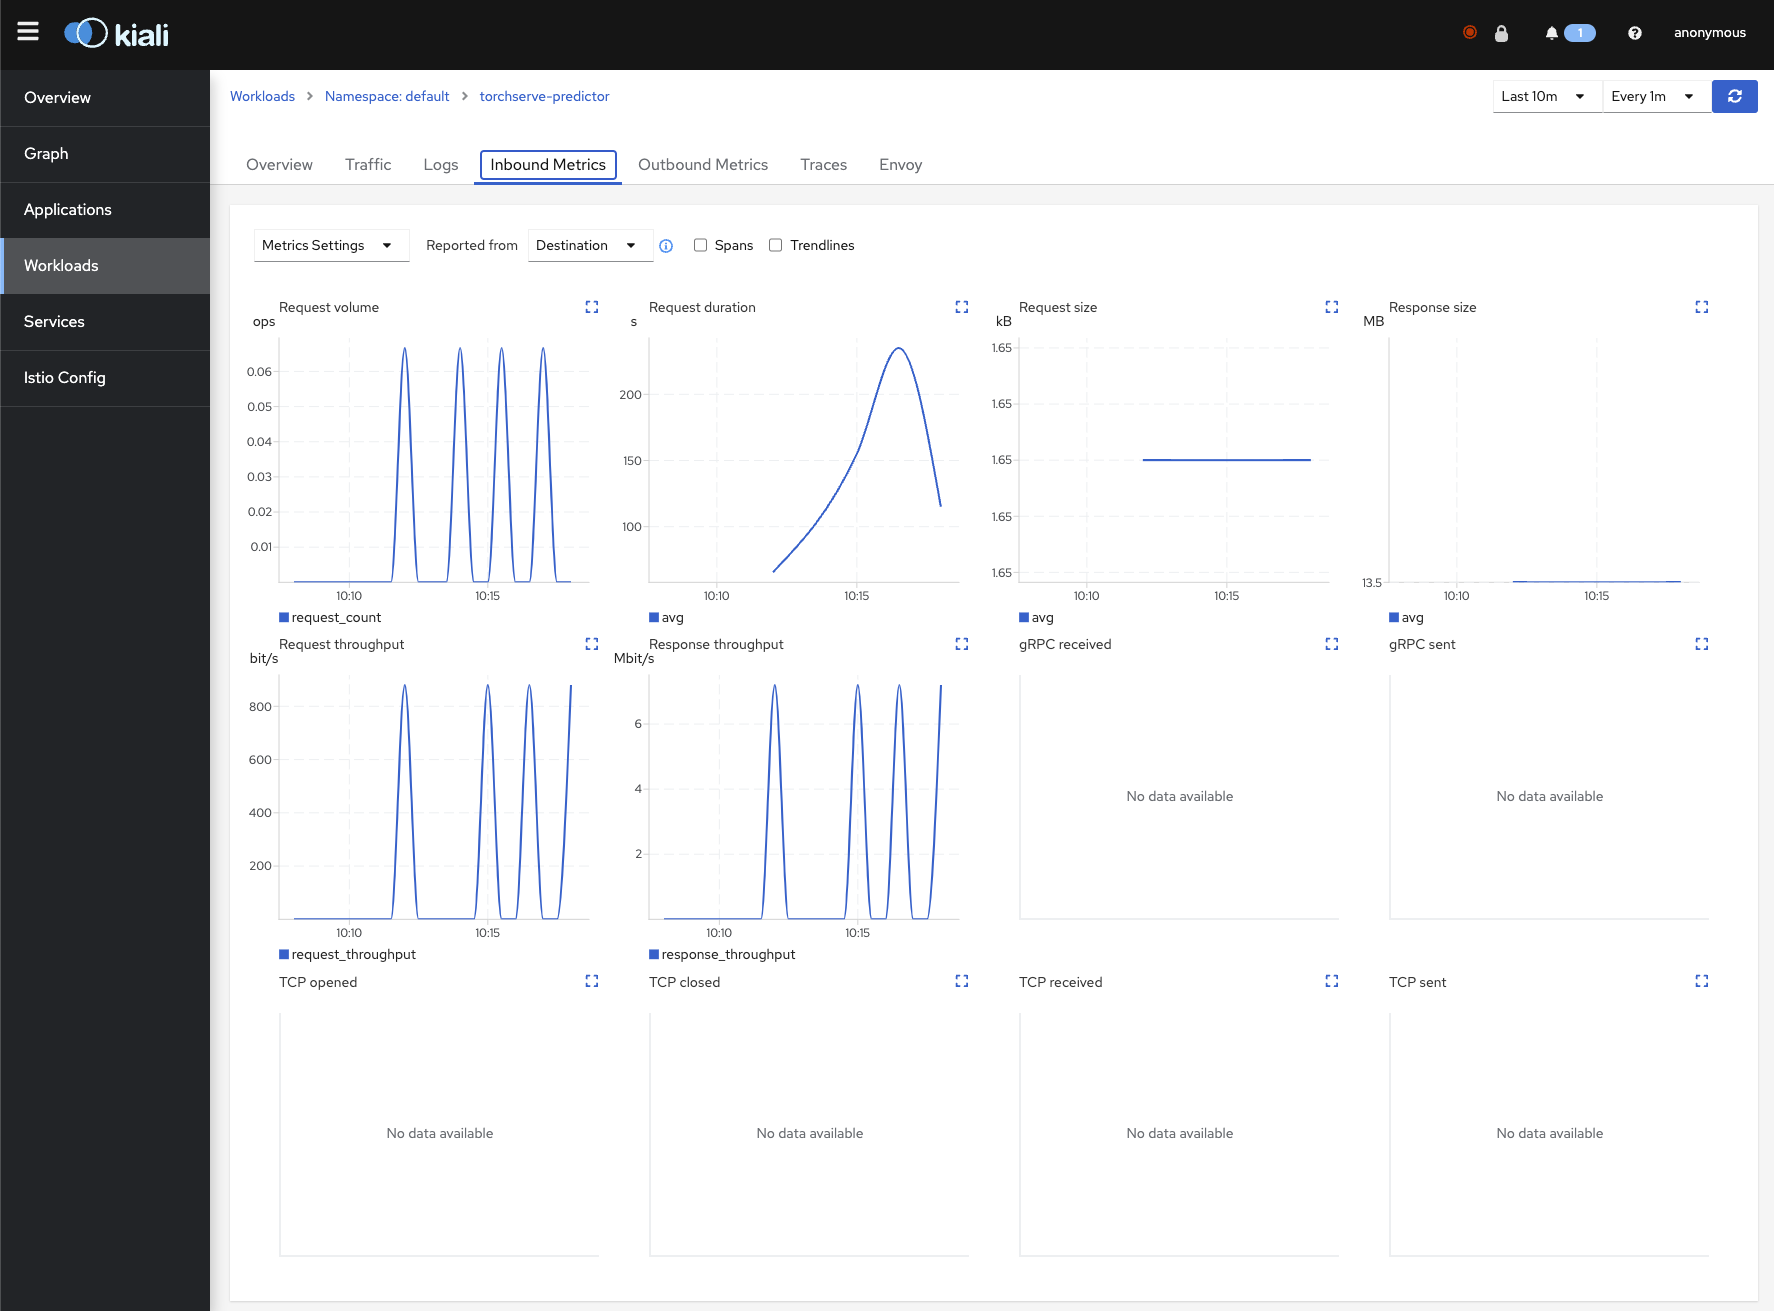
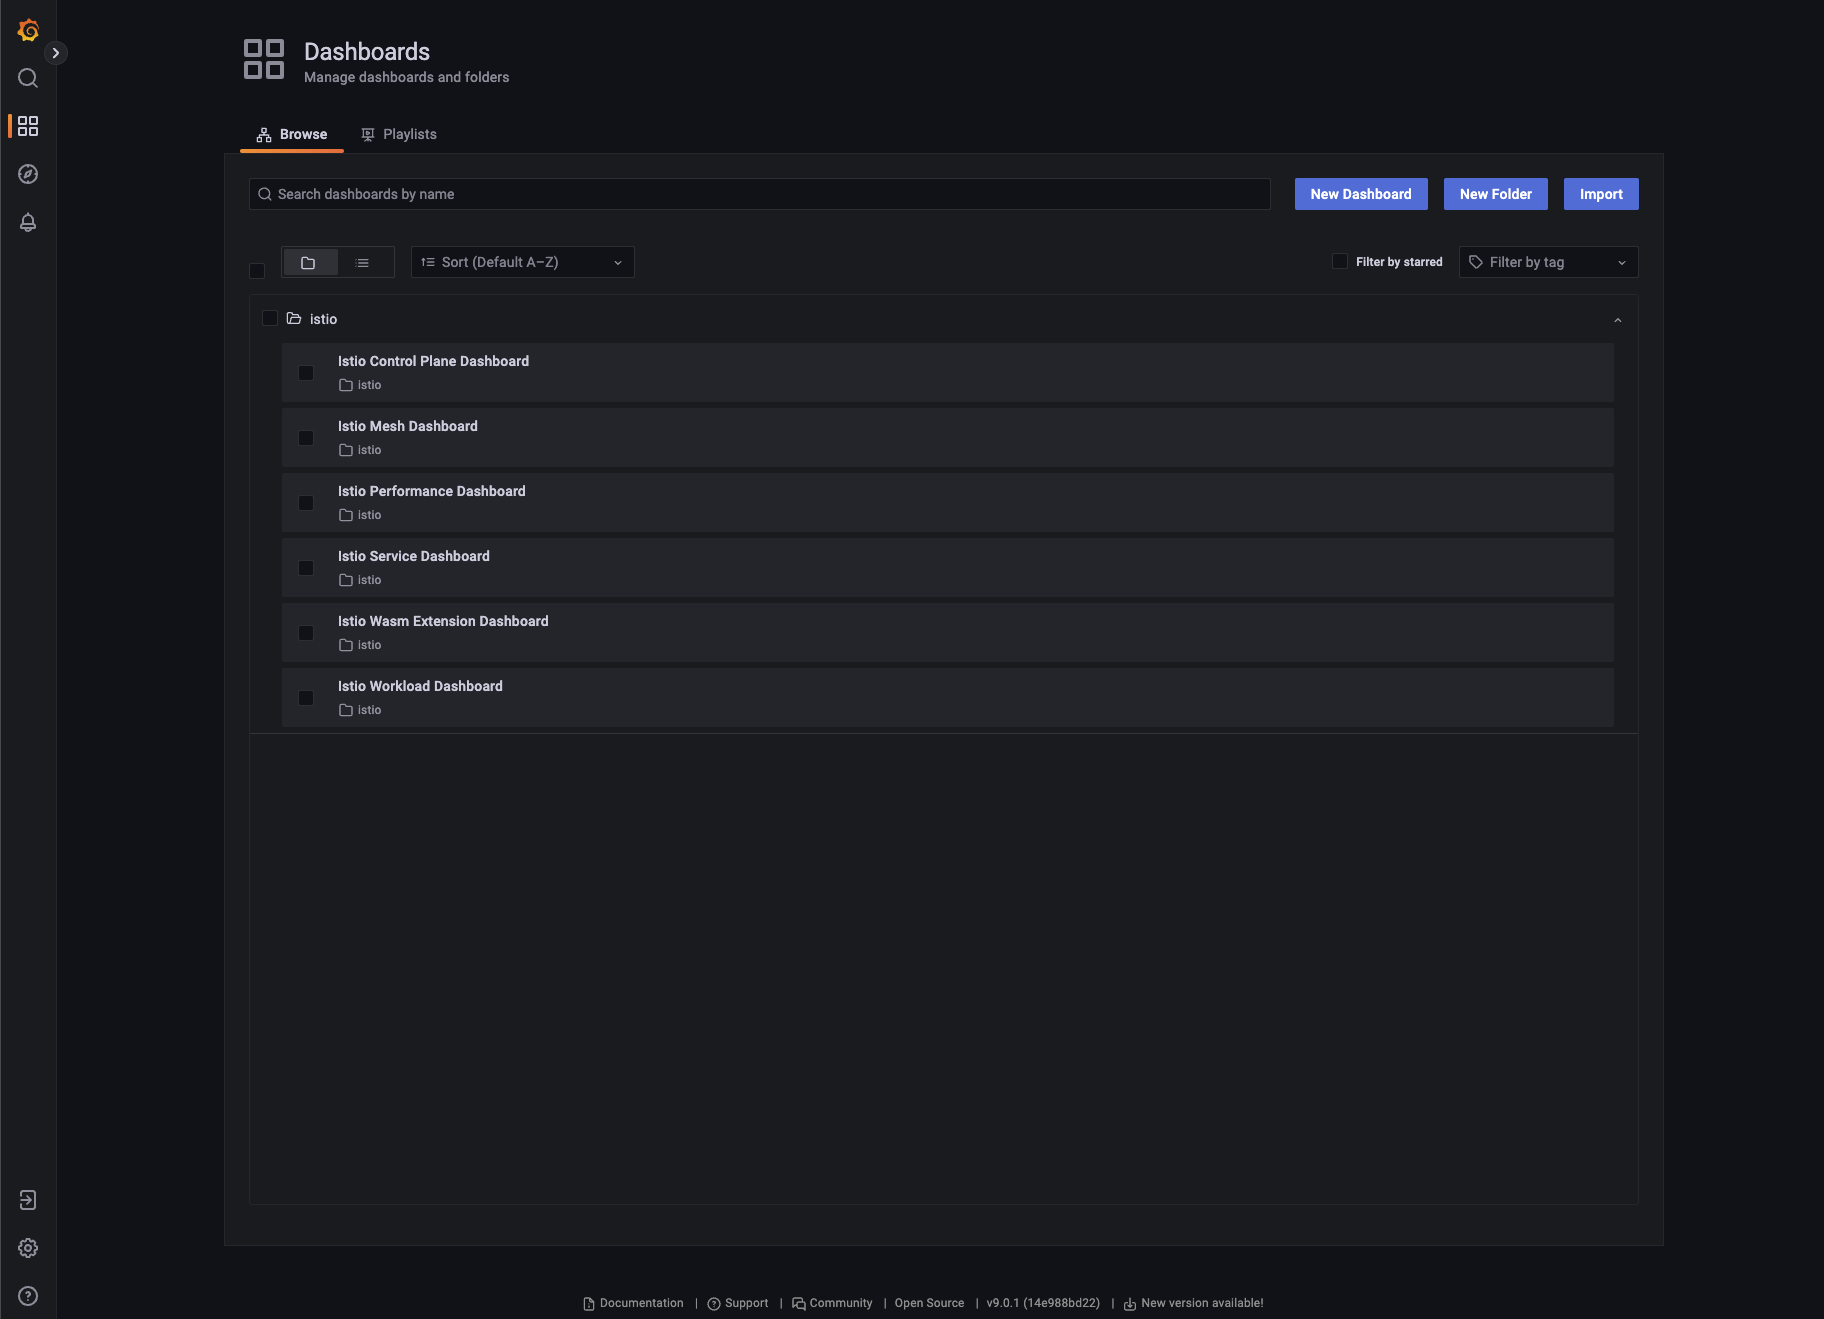
Grafana Metrics for Istio
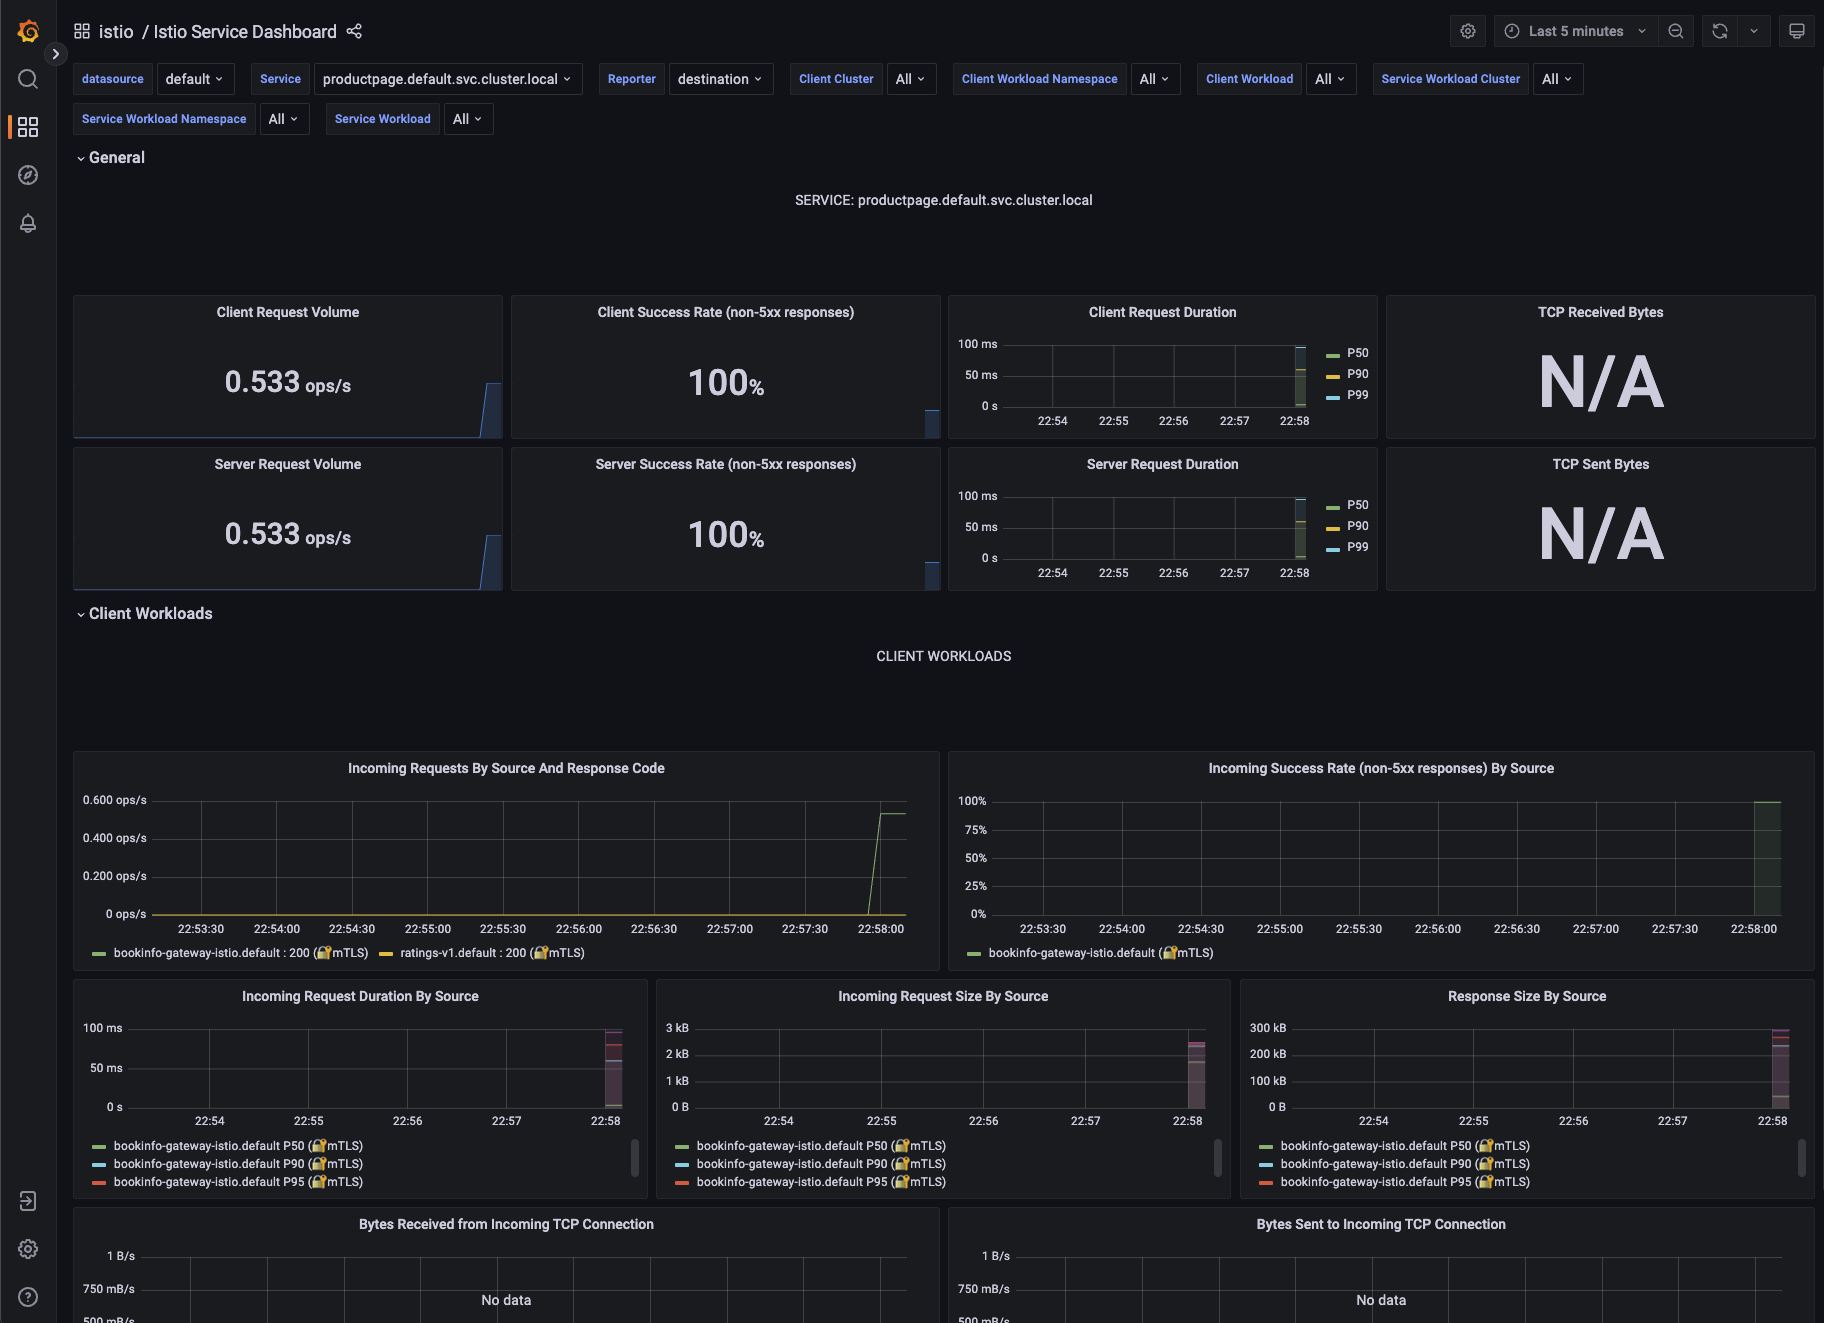
Metrics for the SDXL Deployment